ERCOT Storage Performance
ERCOT Storage Performance | H1 2026
Looking back at storage asset operations and performance outcomes from H1 2026.
The first six months of 2026 asked ERCOT storage operators to trade at a new pace. RTC+B added five new Real-Time Ancillary Service products to bid every five minutes. Co-optimizing Energy and Ancillary Services (AS)at that speed is difficult. However, for the most part, the fleet stepped up to the plate. While revenue was down compared to H1 2025 (-24% for the median earning asset and -22% on average for the top 20 earning assets), performance was up (+5% for the median performer, +2% for the top 20). All-in-all, this indicates that revenue opportunity was down, but the fleet did a slightly better (albeit similar) job capturing it.
The top performing ERCOT asset in 2026 captured 20% more DA TBx value than 2025’s top performer. The growing spread between top performers and the ERCOT median underscores how challenging this market is for most. While a few have the tools to excel, many have room for improvement.
We unpack this more below.
Revenue overview
RT Energy accounted for the majority of revenue across the fleet in these six months. However, top earners differentiated by layering on DA Energy when the premiums were high. The top 20 revenue generators leaned into DA Energy more than the rest of the fleet, capturing 12% of their revenue versus just 3% fleet-wide.
That gap traced back to Winter Storm Fern. The top earners sat at higher-priced nodes than the rest of the fleet, and they had the conviction to bid into DA prices during the storm and capture them.
- Highest earning asset made $29.54/kW, while the top 50 revenue generators averaged $18.24/kW
- Median asset brought in $9.71/kW, with the fleet average higher at $10.15/kW
- RT Energy made up the majority of revenue at 68%
Performance overview
The top 20 performers also saw the majority of their revenue in RT Energy, but at a lower share than the fleet – 52% versus 68%. They leaned harder into Ancillary Services (AS) instead, pulling 25% of revenue from DA AS and 16% from RT AS.
DA Energy made up just 6% of the top 20 performers’ revenue, and only two of the top 20 earners also ranked among the top 20 performers. The overlap was thin because the two groups got there differently. The top earners rode a single event, Winter Storm Fern, while the top performers spread revenue across Energy and AS throughout the six month period. That layering, not one big bet, is what lets the top performers capture more of the opportunity consistently.
- Top performing asset captured 142% of its DA TBx opportunity, and the top 50 averaged 87%.
- Median asset captured 59%, with the fleet average slightly higher at 56%.
The impact of Winter Storm Fern
ERCOT is renowned for weekends like Winter Storm Fern – when tight grid conditions can lead to extreme volatility and send energy prices soaring. These types of events bolster the returns of storage and generation assets – in some cases contributing more revenue than months of standard operations.
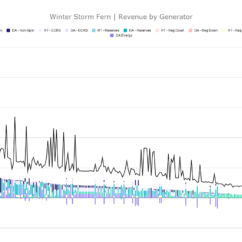
Looking at fleet revenue metrics over the course of the first six months of 2026 we see that Fern increased revenue across the board – with disproportionately large gains for the top earners. When including Fern in the data set (compared to removing the earning from that weekend):
- Fleet average revenue is 22% higher
- Top 20 assets’ revenue is 125% higher
- Top earning asset made 162% more revenue – amounting to $18.28/kW
The weekend had the opposite, though to a lesser extent, impact on performance, with DA TBx capture down between 2-9%.
On this late January weekend, price formation played out differently than most expected. The Day-Ahead Market carried premiums across energy and Ancillary Services. But with so much risk associated with offering into the DA on these high volatility weekends, where concerns over not being able to recharge or missing out on market cap RT prices – much of the fleet missed out on big opportunities.
Given this, it is no surprise that the winning strategy over Fern weekend was to take the bet on DA Energy and DA AS. Top earners hit the DA Energy premiums, top performers leveraged DA AS more heavily. This dynamic, and the size of the Fern opportunity changed the view on what worked for the whole half. When looking at the fleet’s revenue mix from Jan-June 2026:
The contrast in the revenue stacks of storage assets with vs without Fern is stark.
This all just goes to show that, when thinking through operating strategy, the details matter. High volatility periods can skew the data and could lead one to overweight the role certain products play. In a similar vein, what will be most performant on the average ERCOT day may not be the highest impact during high risk periods.
Interesting days deep dive
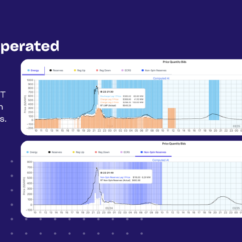
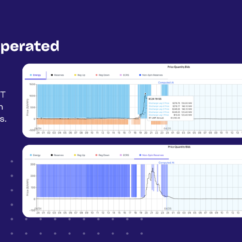
*Top earners defined as highest $/kW
**Top performers defined as highest percent of DA TBx captured – how much of the available Day-Ahead opportunity an asset captured at its duration (‘x’) and node.
-
ERCOT Storage Performance
June 2026 | ERCOT
09/14/26
-
ERCOT Storage Performance
May 2026 Performance | ERCOT
08/11/26
-
ERCOT Storage Performance
Q1 2026 Performance | ERCOT
06/16/26
-
ERCOT Storage Performance
April 2026 Performance | ERCOT
07/14/26
-
ERCOT Storage Performance
March 2026 Performance | ERCOT
06/11/26
-
ERCOT Storage Performance
3 Months Post RTC+B Performance | ERCOT
05/20/26
-
ERCOT Storage Performance
February 2026 Performance | ERCOT
05/14/26
-
ERCOT Storage Performance
January 2026 Performance | ERCOT
04/16/26
-
ERCOT Storage Performance
Winter Storm Fern Performance | ERCOT
04/16/26
-
ERCOT Storage Performance
December 2025 Performance | ERCOT
03/20/26
-
Case Studies
Capturing ERCOT’s first post-RTC+B price spike
12/22/25
-
ERCOT Storage Performance
November 2025 Performance | ERCOT
02/18/26
-
ERCOT Storage Performance
October 2025 Performance | ERCOT
01/14/26
-
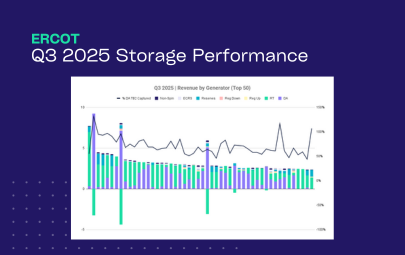
ERCOT Storage Performance
Q3 2025 Performance | ERCOT
12/16/25
-
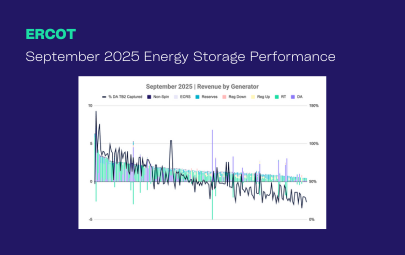
ERCOT Storage Performance
September 2025 Performance | ERCOT
12/15/25
-
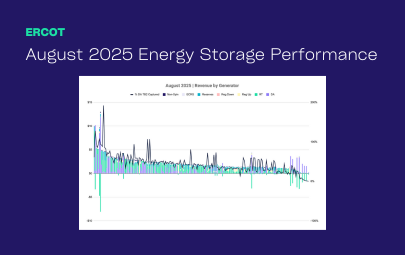
ERCOT Storage Performance
August 2025 Performance | ERCOT
11/19/25
-
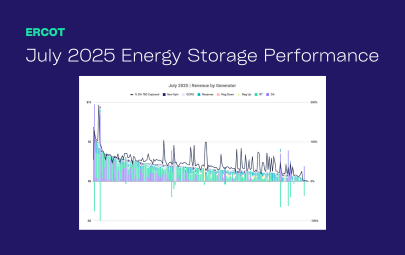
ERCOT Storage Performance
July 2025 Performance | ERCOT
10/15/25
-
ERCOT Storage Performance
H1 2025 Performance | ERCOT
09/16/25
-
ERCOT Storage Performance
June 2025 Performance | ERCOT
09/16/25
-
ERCOT Storage Performance
May 2025 Performance | ERCOT
08/12/25
-
ERCOT Storage Performance
April 2025 Performance | ERCOT
07/15/25
-
ERCOT Storage Performance
Q1 2025 Performance | ERCOT
06/26/25
-
ERCOT Storage Performance
March 2025 Performance | ERCOT
06/17/25
-
ERCOT Storage Performance
February 2025 Performance | ERCOT
05/13/25
-
ERCOT Storage Performance
January 2025 Performance | ERCOT
04/28/25
-
ERCOT Storage Performance
2024 Storage Performance | ERCOT
04/09/25
-

Guides
Benchmarking Energy Storage Performance in ERCOT: What Good Looks Like
02/24/25