ERCOT Storage Performance
ERCOT Storage Performance | June 2026
Looking back at storage asset operations and performance outcomes from June 2026.
June was a lighter month for ERCOT storage revenue. The median asset’s revenue fell 34% compared to May, while the median performer saw a much smaller drop of 8%. That gap points to a smaller opportunity to capture in June than May.
In terms of what opportunity did exist, Real-Time (RT) Energy made up the majority of revenue across the fleet, in line with the price premium it held over Day-Ahead (DA) Energy in most hours of the month. DA Energy only won the premium in a couple of hours. With that dynamic, a DA Energy position wasn’t worth the risk it carries for most, so the majority of operators stayed in RT instead. The few who took DA Energy positions largely saw negative or low returns.
-
$4.01/kW
Highest earning asset
-
178%
DA TBx captureHighest performing asset
Revenue overview
The fleet’s highest earning asset generated nearly 1.5x the revenue of the second highest earner, and 5x that of the median asset. Similar to the rest of the fleet, it made almost all of its revenue in RT Energy. While it may seem as though this revenue win indicates strong RT execution, the asset only captured 48% of its RT TBx, which tells us that the battery benefitted from a volatile node, helping bolster revenue outcomes.
Across the fleet, RT Energy was the majority revenue driver, which tracks with a month where RT held the price premium in 75% of hours.
- Highest earning asset made $4.01/kW, while the top 50 revenue generators averaged $1.86/kW
- Median asset brought in $0.80/kW, with the fleet average higher at $0.90/kW
- RT Energy made up the majority of revenue at 72%
Performance overview
The top performing asset captured roughly 3x the DA TBx of the median asset, again driven largely by its RT Energy performance. That RT-heavy pattern held across the top five performers too. All made the majority of revenue in RT Energy, and also picked up a share of revenue (17%) from RT Ancillary Services (AS), not too far off the fleet’s 22% average, driven mainly by RT Non-Spin. Interestingly, DA Non-Spin prices actually held the premium during most hours of the month, yet DA AS still took a back seat to RT AS overall.
- Top performing asset captured 178% of its DA TBx opportunity, and the top 50 averaged 97%.
- Median asset captured 59%, with the fleet average slightly lower at 56%.
*Top earners defined as highest $/kW
**Top performers defined as highest percent of DA TBx captured – how much of the available Day-Ahead opportunity an asset captured at its duration (‘x’) and node.
-
ERCOT Storage Performance
May 2026 Performance | ERCOT
08/11/26
-
ERCOT Storage Performance
Q1 2026 Performance | ERCOT
06/16/26
-
ERCOT Storage Performance
April 2026 Performance | ERCOT
07/14/26
-
ERCOT Storage Performance
March 2026 Performance | ERCOT
06/11/26
-
ERCOT Storage Performance
3 Months Post RTC+B Performance | ERCOT
05/20/26
-
ERCOT Storage Performance
February 2026 Performance | ERCOT
05/14/26
-
ERCOT Storage Performance
January 2026 Performance | ERCOT
04/16/26
-
ERCOT Storage Performance
Winter Storm Fern Performance | ERCOT
04/16/26
-
ERCOT Storage Performance
December 2025 Performance | ERCOT
03/20/26
-
Case Studies
Capturing ERCOT’s first post-RTC+B price spike
12/22/25
-
ERCOT Storage Performance
November 2025 Performance | ERCOT
02/18/26
-
ERCOT Storage Performance
October 2025 Performance | ERCOT
01/14/26
-
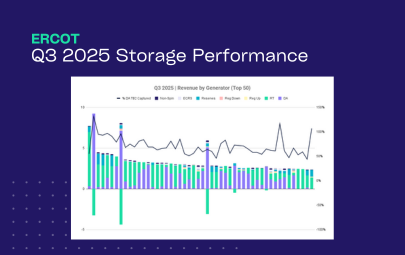
ERCOT Storage Performance
Q3 2025 Performance | ERCOT
12/16/25
-
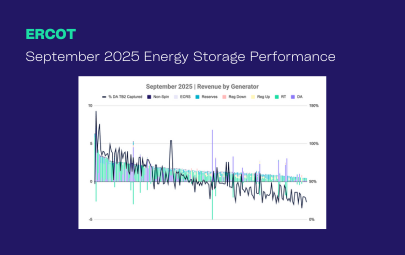
ERCOT Storage Performance
September 2025 Performance | ERCOT
12/15/25
-
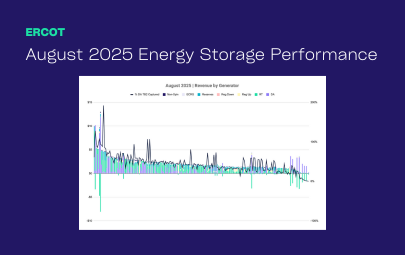
ERCOT Storage Performance
August 2025 Performance | ERCOT
11/19/25
-
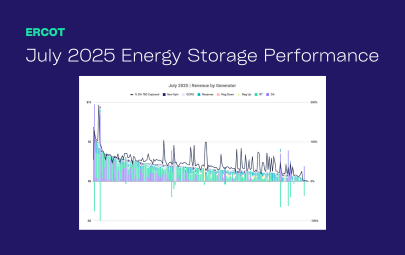
ERCOT Storage Performance
July 2025 Performance | ERCOT
10/15/25
-
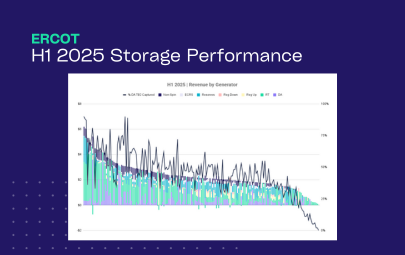
ERCOT Storage Performance
H1 2025 Performance | ERCOT
09/16/25
-
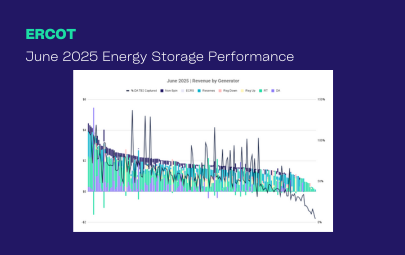
ERCOT Storage Performance
June 2025 Performance | ERCOT
09/16/25
-
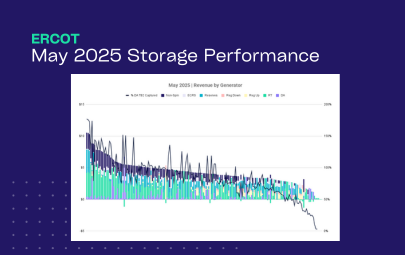
ERCOT Storage Performance
May 2025 Performance | ERCOT
08/12/25
-
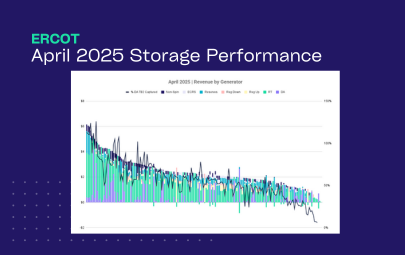
ERCOT Storage Performance
April 2025 Performance | ERCOT
07/15/25
-
ERCOT Storage Performance
Q1 2025 Performance | ERCOT
06/26/25
-
ERCOT Storage Performance
March 2025 Performance | ERCOT
06/17/25
-
ERCOT Storage Performance
February 2025 Performance | ERCOT
05/13/25
-
ERCOT Storage Performance
January 2025 Performance | ERCOT
04/28/25
-
ERCOT Storage Performance
2024 Storage Performance | ERCOT
04/09/25
-

Guides
Benchmarking Energy Storage Performance in ERCOT: What Good Looks Like
02/24/25