ERCOT Storage Performance
ERCOT Storage Performance | 3 Months Post RTC+B
Looking back at storage asset operations and performance outcomes from 3 Months Post RTC+B.
Three months in, after December, January, and February, the Real-Time Co-Optimization plus Batteries (RTC+B) energy storage operations picture is more clear. The revenue opportunity was real, but only operators with the right tools – forecasting, optimization, and disciplined execution – captured it. Winter Storm Fern in late January drove most of the 3 month’s revenue, and the data underneath shows just how much the right setup mattered.
Revenue overview
The first three months of RTC+B revealed a massive revenue gap among ERCOT storage operators. The top earner made $22.71/kW, 4.5x the median. That spread is the signature of a market where nodal dynamics and strategy compound — the top earners sat on higher-priced nodes than the rest of the fleet and executed on the prices those nodes delivered.
- Highest earning asset made $22.71/kW, while the top 50 revenue generators averaged $9.78/kW
- Median asset brought in $4.87/kW, with the fleet average higher at $5.25/kW
- Real-Time (RT) Energy made up the majority of the stack at 54%, with Day-Ahead Ancillary Services (DA AS) next at 30%
Take Winter Storm Fern days out of the 3 months and the picture changes fast. Fleet average revenue drops 36%. The top earner drops 48%.
The top earner still outperforms the median by 4x in both scenarios. Well-executed operating strategy and nodal pricing drove that advantage, with Fern amplifying the spread.
Revenue |
3 Months Post RTC+B |
3 Months Post RTC+B, excluding Winter Storm Fern (Jan 24-26) |
Top |
$22.71 |
$11.73 |
Fleet average |
$5.25 |
$3.34 |
Fleet median |
$4.87 |
$2.92 |
Performance overview
Revenue tells you what an operator earned. DA TBx capture rate tells you how well they earned it – normalized across the different nodal pricing conditions and durations each operator faced.
Day-Ahead Top-Bottom X (DA TBx) is the maximum a battery could earn by perfectly arbitraging the X highest- and lowest-priced hours of the Day-Ahead Energy Market at its node each day, expressed in $/kW. X is the asset’s duration — DA TB1 for a 1-hour battery, DA TB1.5 for a 1.5-hour, DA TB2 for a 2-hour. Divide actual revenue by that benchmark and you get the TBx capture rate – the fraction of the available opportunity the operator actually converted. (For a deeper walkthrough, see our storage performance benchmarks guide.)
By that measure, the top performer captured 2x the fleet median. The revenue divergence shows up here too, just less dramatically. Since capture rate normalizes for node and duration, what separates the top from the middle is a well-executed operating strategy.
- Top performing asset captured 122% of its DA TBx opportunity, and the top 50 averaged 88%
- Average and median asset captured 51%
Across the full three months, the opportunity was nearly split between Day-Ahead and Real-Time – averaging $11.75 DA TBx and $11.15 RT TBx.
Strip Winter Storm Fern out:
- Average DA TBx opportunity drops 36%, falling to $6.15/kW
- RT TBx falls less, to $9.63/kW
- Average DA TBx capture rate ticks up slightly, reflecting the fleet executed marginally better outside the storm
Two things stand out. First, Fern was a Day-Ahead-heavy event. Pull those three days out and the bulk of the remaining opportunity lived in Real-Time, not Day-Ahead. Second, even with capture rates ticking up post-Fern, average DA TBx capture sat at just 54%.
With or without Winter Storm Fern, the fleet left roughly half the Day-Ahead opportunity on the table. Three months in, that’s a clear signal that RTC+B is still a market being figured out.
DA TBx |
3 Months Post RTC+B |
3 Months Post RTC+B, excluding Winter Storm Fern (Jan 24-26) |
Top (%) |
122% |
111% |
Fleet average (%) |
51% |
54% |
Fleet median (%) |
51% |
58% |
Top ($/kW) |
$39.88 |
$20.32 |
Fleet average ($/kW) |
$11.75 |
$6.15 |
Fleet median ($/kW) |
$10.35 |
$5.50 |

How the market shook out
On average across the three months, DA Energy carried the premium across all hours. Set Fern aside and that flips. RT Energy prices ran higher than DA during peak hours.
That tracks with where most revenue landed. The fleet average and the top 20 earners both pulled the majority of their revenue from RT Energy, 55% and 57% respectively.
But the top 20 performers (measured by DA TBx capture rate) tell a different story. DA AS carried 50% of their revenue, vs. 30% for the fleet and just 16% for the top earners.
DA AS ran at a premium across most hours. The top performers committed. The rest of the fleet held for energy and RT AS. RTC+B was designed to converge DA and RT prices and give batteries the flexibility to swing between products in real time. After initial DA premiums in December, DA and RT AS pricing has begun to converge, while DA vs. RT energy spreads continue to be dynamic. The top performers have responded accordingly, capturing DA AS and Energy premiums while also keeping their RT optionality.
Performance by duration
The pattern holds at every duration. RT Energy carries a large stack across every duration, and the longer the asset, the bigger the RT Energy share gets.
Breakdown by asset duration:
- Short duration assets (≤1.24 hours) anchored in DA AS, with the top 10 leaning even more heavily there. Limited discharge capacity makes AS commitment the natural fit.
- Mid-duration assets (1.25–1.74 hours) pulled DA Energy meaningfully into the stack. The top 10 leaned even further into DA Energy, carrying a more balanced approach across products.
- Long duration assets (>1.75 hours) went majority RT Energy. For the top 10, RT Energy shrank, and DA Energy revenue made up the difference.

Interesting days
Revenue wasn’t evenly distributed – fewer than 10 days carried most of the 3 month’s earnings.
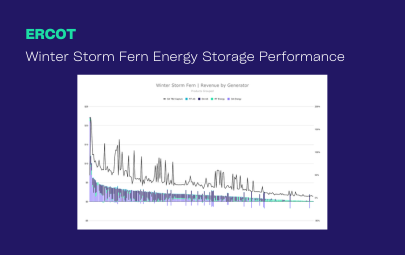
- Winter Storm Fern (January 25-31): The top 6 revenue-generating days all clustered in this window, with the storm days and days leading out of the storm also pulling outsized revenue. See the full Winter Storm Fern recap.
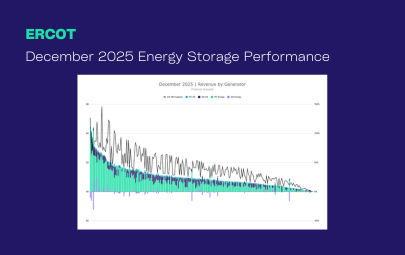
- December 14: The next-biggest single day, outside of Fern. See the December 2025 recap.
The leaderboard was set by operators who consistently showed up ready with forecasts that called the price volatility correctly, DA commitments positioned to capture the premium when prices spiked, and an optimization approach agile enough to re-route as conditions shifted.
*Top earners defined as highest $/kW
**Top performers defined as highest percent of DA TBx captured
-
ERCOT Storage Performance
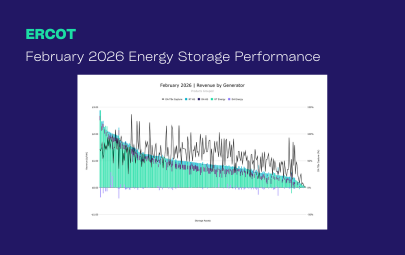
February 2026 Performance | ERCOT
05/14/26
-

ERCOT Storage Performance
January 2026 Performance | ERCOT
04/16/26
-
ERCOT Storage Performance
Winter Storm Fern Performance | ERCOT
04/16/26
-
ERCOT Storage Performance
December 2025 Performance | ERCOT
03/20/26
-
Case Studies
Capturing ERCOT’s first post-RTC+B price spike
12/22/25
-
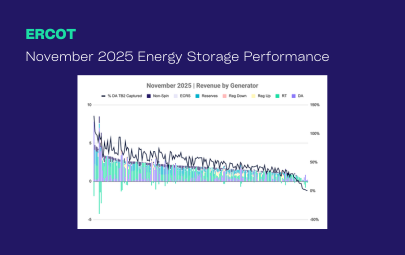
ERCOT Storage Performance
November 2025 Performance | ERCOT
02/18/26
-
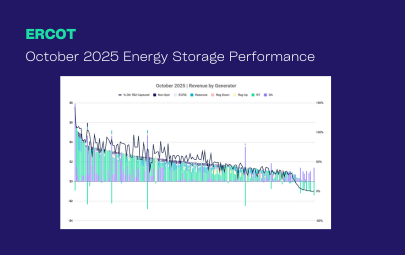
ERCOT Storage Performance
October 2025 Performance | ERCOT
01/14/26
-
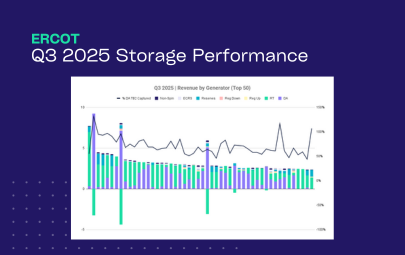
ERCOT Storage Performance
Q3 2025 Performance | ERCOT
12/16/25
-
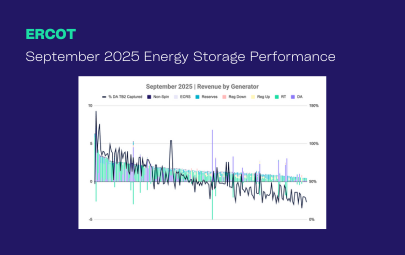
ERCOT Storage Performance
September 2025 Performance | ERCOT
12/15/25
-
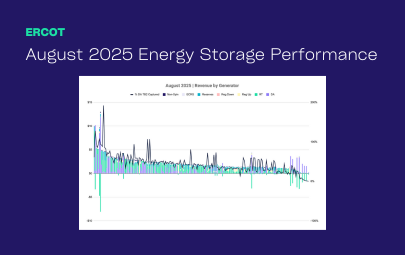
ERCOT Storage Performance
August 2025 Performance | ERCOT
11/19/25
-
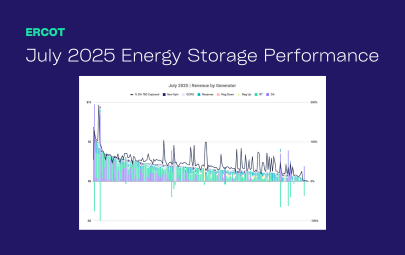
ERCOT Storage Performance
July 2025 Performance | ERCOT
10/15/25
-
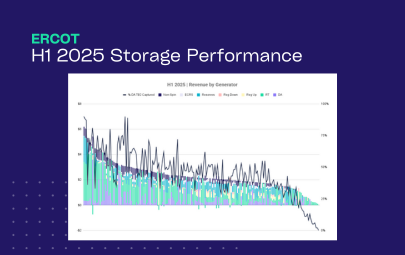
ERCOT Storage Performance
H1 2025 Performance | ERCOT
09/16/25
-
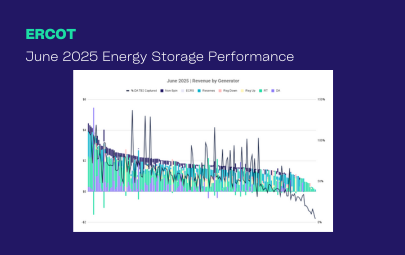
ERCOT Storage Performance
June 2025 Performance | ERCOT
09/16/25
-
ERCOT Storage Performance
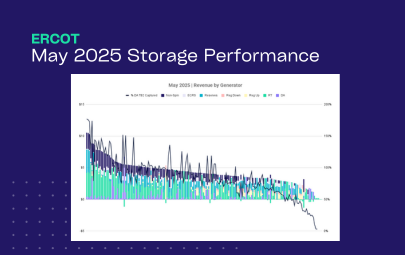
May 2025 Performance | ERCOT
08/12/25
-
ERCOT Storage Performance
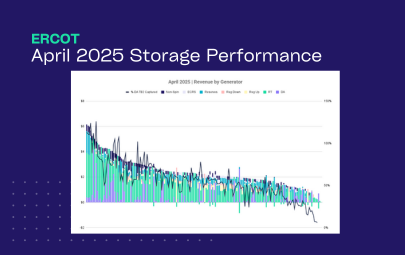
April 2025 Performance | ERCOT
07/15/25
-
ERCOT Storage Performance
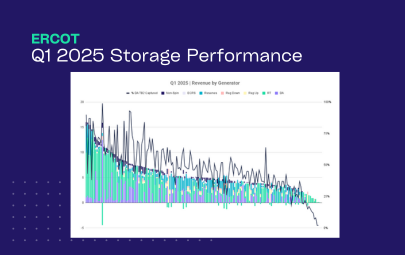
Q1 2025 Performance | ERCOT
06/26/25
-
ERCOT Storage Performance
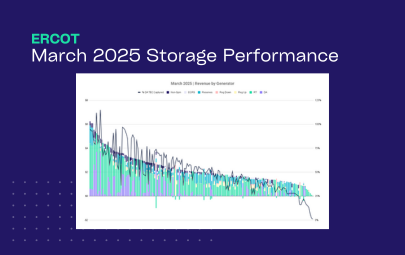
March 2025 Performance | ERCOT
06/17/25
-
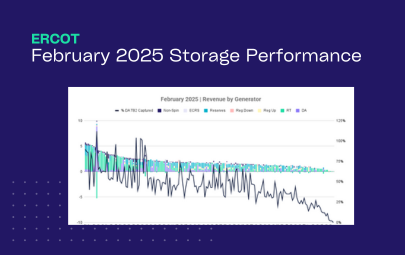
ERCOT Storage Performance
February 2025 Performance | ERCOT
05/13/25
-
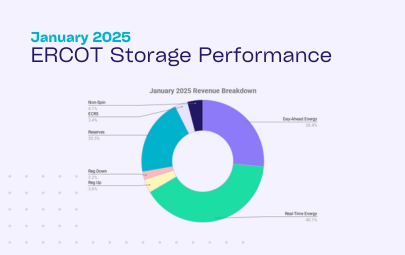
ERCOT Storage Performance
January 2025 Performance | ERCOT
04/28/25
-
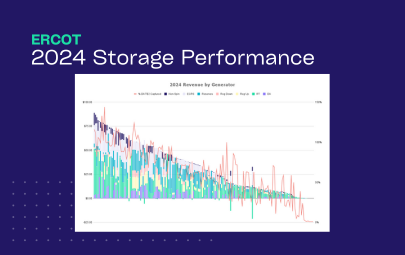
ERCOT Storage Performance
2024 Storage Performance | ERCOT
04/09/25
-

Guides
Benchmarking Energy Storage Performance in ERCOT: What Good Looks Like
02/24/25