ERCOT Storage Performance
ERCOT Storage Performance | March 2026
Looking back at storage asset operations and performance outcomes from March 2026.
March delivered classic shoulder season results for ERCOT energy storage operators. March was the most Real-Time-dominated month since RTC+B launched, even as DA Energy held the price premium 61% of peak hours. Operating energy storage well in March meant having the forecasting precision and the tools to act on them before the opportunity passed.
Revenue overview
Where February was the leanest revenue month since RTC+B launched, March delivered some improvement with fleet median revenue up 45% month-over-month. That improvement was almost entirely driven in Real-Time as DA Energy finished negative on average fleet-wide.
The exception was the top earner. At $8.43/kW, DA Energy made up 20% of the asset’s revenue – one of the only assets across the fleet to correctly call DA positions and profit from them. DA presented an opportunity in March, but RT presented an outsized opportunity in a concentrated set of hours. Capturing it required the strategy and tools to find those moments. The top earner did both.
- Highest earning asset made $8.43/kW, while the top 50 revenue generators averaged $3.07/kW
- Median asset brought in $1.30/kW, with the fleet average higher at $1.50/kW
- RT energy made up the majority of revenue at 92%
Performance overview
The top performer hit 176% DA TBx capture, the highest capture rate since RTC+B. The average DA TBx capture rate is also trending up since January.
We define top performance by DA TBx capture — how much of the available Day-Ahead opportunity an asset captured at its duration (‘x’) and node.
RT Energy drove the top performer’s revenue while DA Energy finished in the red. That negative DA reflects a costly but common March mistake — either discharging into DA Energy when RT Energy prices ran higher, or charging into DA Energy.
Most operators paid for DAM exposure in March. The top performer absorbed those losses too, and still more than doubled the fleet median by staying agile enough to capture the large RT upsides.
- Top performing asset captured 176% of its DA TBx opportunity, and the top 50 averaged 98%.
- Median asset captured 65%, with the fleet average slightly lower at 63%.
Revenue mix
March was the first month since RTC+B where positive fleet revenue only came from the Real-Time Market (RTM). DA Energy and DA AS both finished negative on average.
That doesn’t mean the DAM offered no opportunity. Top 20 earners and performers generated positive DAM revenue by correctly identifying the hours where DA held the premium – the top earner is a clear example. But the prices made it a difficult call.
Energy
DA Energy held the premium over RT Energy in 61% of peak hours and 56% of all hours, margins narrow enough to make the call difficult. And when RT spiked, the upside in those hours far outweighed the more consistent DA premium.
Ancillary Services
RT held the premium for the majority of hours in AS, especially concentrated in the evening. Non-Spin was the most dramatic shift, with RT running roughly $15/MWh above DA during the 9-10pm window.
Since RTC+B launched, DA AS had been a meaningful revenue contributor through February. In February, RT AS emerged and nearly matched DA AS in the revenue mix. In turn, in March, DA AS turned negative while RT AS contributed 12% of fleet revenue.
In RTC+B, the margin for error is narrow. March came down to forecasting precision and execution – knowing which products and hours were worth committing to, and acting on that before the window closed.

Performance by duration
The RT Energy dominance seen across the fleet held at every duration band in March. Within each duration class, what separated the top operators came down to DAM exposure management – getting the DA call wrong meant less capacity available when RT spiked, and the fleet’s negative DAM revenue shows how difficult that call was.
Breakdown by asset duration:
- Short duration assets (≤1.24 hours) carried a negative DA AS drag across the full fleet. The top 10 carried far less of it, keeping more capacity available for RT Energy.
- Mid-duration assets (1.25–1.74 hours) were the only duration class where DA Energy generated positive revenue, with the top 10 capturing even more. That’s in part because the top earning asset we mentioned earlier – which made 20% of its revenue from DA Energy – sits within this class.
- Long duration assets (>1.75 hours) saw the full fleet carry a combined DA Energy and DA Non-Spin drag. The top 10 got that near zero, preserving more of their RT Energy upside.
Across all three duration classes, the top performers found their edge in DA exposure management — either capturing the right DA positions or avoiding the wrong ones.
Interesting day deep dive
Two days in March stand out. March 8 was a day the entire fleet averaged negative revenue. And on the opposite end of the spectrum, March 23 was a single day that captured 20% of total fleet revenue for the month (breakdown below).
March 23, 2026
Prices were quiet through most of the day. Then, starting around 6pm, the combination of solar dropping off and wind coming in well below forecasts tightened supply faster than the market had priced in. By 9pm, RT prices had spiked sharply.
- Midnight-6pm: RT carried a modest premium over DA
- 6pm onward: Solar cliff combined with wind underperformance drove RT well above DA. RT spiked, exceeding $800/MWh across hubs between 9-10pm
- 11pm: Prices normalized
The window was short. Assets that ran out of SOC before the peak missed it entirely.
How did the top earning asset operate on March 23rd?
The top earner, a ~4 hour, 100MW asset, finished at $1.50/kW, capturing 351% DA TBx.
The asset entered the day at full SOC. When RT prices began climbing, it was ready. Between 9-10pm, when the RT LMP reached ~$910/MWh, the operator discharged the full 100 MW into RT energy and captured the spike cleanly.
With most of ERCOT’s battery fleet at a 1-2 hour duration, this resource had a structural advantage. Shorter assets face a real constraint on days like this where RT prices start taking off and remain elevated for multiple hours – discharge too early or hold back SOC – and you may miss the peak. This operator didn’t have to make that tradeoff. It could sustain a full discharge across the entire spike window, running down to zero SOC right as RT prices dropped.
$1.50/kW. 351% of available DA value captured. On a day when most of the fleet was energy constrained, duration and preparation did the work.
*Top earners defined as highest $/kW
**Top performers defined as highest percent of DA TBx captured
-
ERCOT Storage Performance
February 2026 Performance | ERCOT
05/14/26
-

ERCOT Storage Performance
January 2026 Performance | ERCOT
04/16/26
-
ERCOT Storage Performance
Winter Storm Fern Performance | ERCOT
04/16/26
-
ERCOT Storage Performance
December 2025 Performance | ERCOT
03/20/26
-
Case Studies
Capturing ERCOT’s first post-RTC+B price spike
12/22/25
-
ERCOT Storage Performance
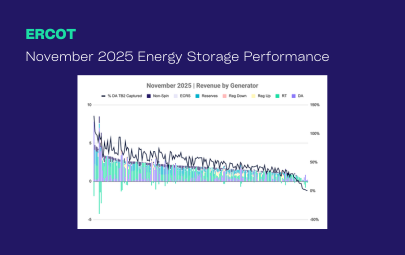
November 2025 Performance | ERCOT
02/18/26
-
ERCOT Storage Performance
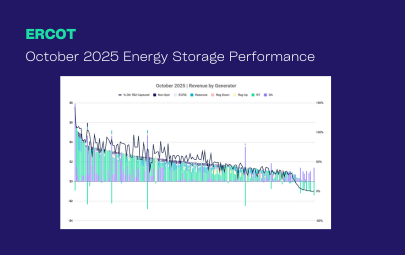
October 2025 Performance | ERCOT
01/14/26
-
ERCOT Storage Performance
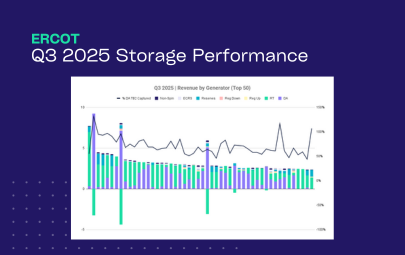
Q3 2025 Performance | ERCOT
12/16/25
-
ERCOT Storage Performance
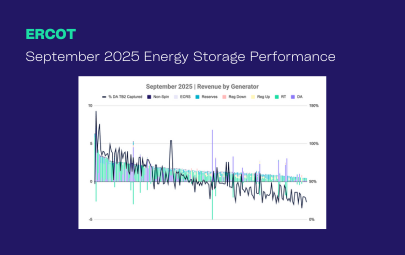
September 2025 Performance | ERCOT
12/15/25
-
ERCOT Storage Performance
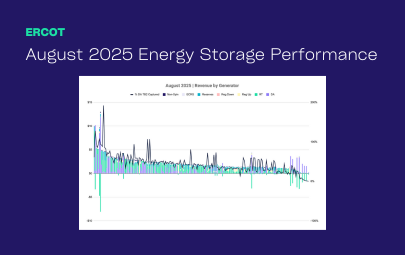
August 2025 Performance | ERCOT
11/19/25
-
ERCOT Storage Performance
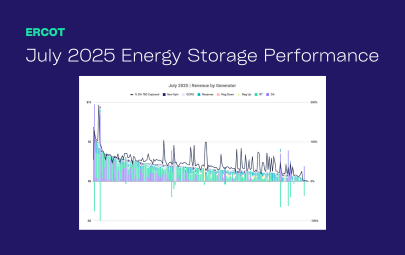
July 2025 Performance | ERCOT
10/15/25
-
ERCOT Storage Performance
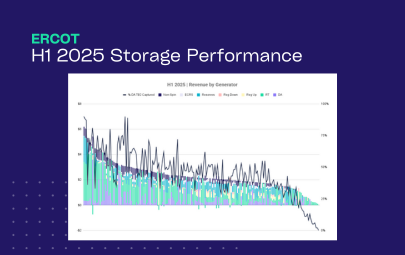
H1 2025 Performance | ERCOT
09/16/25
-
ERCOT Storage Performance
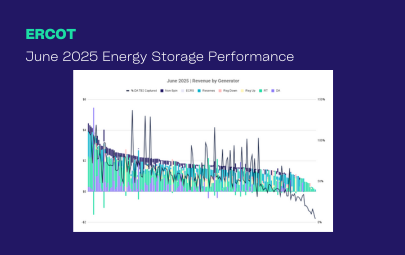
June 2025 Performance | ERCOT
09/16/25
-
ERCOT Storage Performance
May 2025 Performance | ERCOT
08/12/25
-
ERCOT Storage Performance
April 2025 Performance | ERCOT
07/15/25
-
ERCOT Storage Performance
Q1 2025 Performance | ERCOT
06/26/25
-
ERCOT Storage Performance
March 2025 Performance | ERCOT
06/17/25
-
ERCOT Storage Performance
February 2025 Performance | ERCOT
05/13/25
-
ERCOT Storage Performance
January 2025 Performance | ERCOT
04/28/25
-
ERCOT Storage Performance
2024 Storage Performance | ERCOT
04/09/25
-

Guides
Benchmarking Energy Storage Performance in ERCOT: What Good Looks Like
02/24/25