ERCOT Storage Performance
Looking back at storage asset operations and performance outcomes from August 2026.
Energy storage operators in ERCOT earned 81% more in August than in July, with the average asset making $1.99/kW-month, up from $1.10. The gain came entirely from Real-Time (RT) Energy. Day-Ahead (DA) Energy, which added to fleet revenue in July, subtracted from it in August.
The reason was prices. On average in July, DA Energy cleared above RT Energy in every hour of the day. In August, RT Energy cleared above DA Energy in 20 of 24 hours on average. Three of the four hours with DA premiums fell between 4 to 7 p.m., the hours leading into the evening peak. The majority of assets waited for the peak, so stayed away from committing capacity into those few hours where DA cleared higher.
The lesson isn’t that RT Energy always wins. The premium can reverse in a month, in a week, even within hours of the same day, so your operating strategy has to keep moving with the market. And the change in top performer month-over-month makes this clear. August’s top performer ranked #167 in July, a more DA heavy market.
-
$7.10/kW
Highest earning asset
-
146%
DA TBx captureHighest performing asset
Revenue overview
August was the fleet’s strongest revenue month since April with the RT opportunity nearly doubling month over month. This was largely driven by the high RT Energy prices and caused the median asset’s revenue to grow 89% over July, faster than the top 20’s 67%. Taken together, that means the majority of operators were able to convert RT premiums into revenue better than DA premiums.
The top 20 earners went where the premium was. They made 98% of their revenue in RT Energy, compared with 91% for the fleet. The fleet earned 3.8x more of its revenue from RT Ancillary Services (AS) than the top 20 did.
- Highest earning asset made $7.10/kW-month, while the top 50 revenue generators averaged $3.71/kW-month
- Median asset brought in $1.86/kW-month, with the fleet average higher at $1.99/kW-month
- RT Energy made up the majority of revenue at 91%
- RT Energy prices cleared 13% higher than DA Energy during peak hours (7 to 10 p.m.) on average
Performance overview
We usually rank top performance by DA TBx capture – how much of the available Day-Ahead opportunity an asset captured at its duration (‘x’) and node. Even though August was a RT Energy premium month, the DA revenue opportunity and capture rate grew from July.
DA TBx capture ranked operators:
- Top asset captured 146% of its DA TBx opportunity, 55% higher than last month
- Top 50 averaged 109% DA TBx capture, 50% higher than last month
- Median asset captured 82% of its DA TBx opportunity, 64% higher than last month
Since the majority of the revenue opportunity in August was in RT Energy, we also snapshotted how the fleet performed against the more difficult RT TBx capture metric. Unsurprisingly, no storage asset captured as much of their RT opportunity. Since RT prices move interval by interval, capturing the volatility means being charged and ready, and pricing your offers to clear at the right times.
RT TBx capture ranked operators
- Top asset captured 97% of its RT TBx opportunity
- Top 50 averaged 71% RT TBx capture
- Median asset captured 53% of its RT TBx opportunity
Capture of the premium market barely moved when the premium flipped. The top asset captured 94% of its DA TBx opportunity in July and 97% of its RT TBx opportunity in August, and the median asset went from 50% to 53%. Revenue grew because the RT opportunity did, not because operators captured a bigger share of it. The takeaway is similar to July – when the premium moves, operators have to lean further into it, and in an RT premium month that takes real-time agility.
The five days from Aug 22 to 26 put real-time agility to the test, bringing in about 35% of August’s revenue. A heat wave and a wind miss drove price spikes across the weekend of Aug 22 and 23, and the stretch closed with the month’s biggest revenue day on Aug 26, which alone made up about 16% of the month. Operators holding state of charge through the afternoon were the ones ready to sell into the evening peaks. See how Tyba’s optimizer handled those peaks.
*Top earners defined as highest $/kW
**Top performers defined as highest percent of DA TBx captured – how much of the available Day-Ahead opportunity an asset captured at its duration (‘x’) and node.
-
ERCOT Storage Performance
July 2026 | ERCOT
10/13/26
-
ERCOT Storage Performance
June 2026 | ERCOT
09/14/26
-
ERCOT Storage Performance
May 2026 Performance | ERCOT
08/11/26
-
ERCOT Storage Performance
Q1 2026 Performance | ERCOT
06/16/26
-
ERCOT Storage Performance
April 2026 Performance | ERCOT
07/14/26
-
ERCOT Storage Performance
March 2026 Performance | ERCOT
06/11/26
-
ERCOT Storage Performance
3 Months Post RTC+B Performance | ERCOT
05/20/26
-
ERCOT Storage Performance
February 2026 Performance | ERCOT
05/14/26
-
ERCOT Storage Performance
January 2026 Performance | ERCOT
04/16/26
-
ERCOT Storage Performance
Winter Storm Fern Performance | ERCOT
04/16/26
-
ERCOT Storage Performance
December 2025 Performance | ERCOT
03/20/26
-
Case Studies
Capturing ERCOT’s first post-RTC+B price spike
12/22/25
-
ERCOT Storage Performance
November 2025 Performance | ERCOT
02/18/26
-
ERCOT Storage Performance
October 2025 Performance | ERCOT
01/14/26
-
ERCOT Storage Performance
Q3 2025 Performance | ERCOT
12/16/25
-
ERCOT Storage Performance
September 2025 Performance | ERCOT
12/15/25
-
ERCOT Storage Performance
August 2025 Performance | ERCOT
11/19/25
-
ERCOT Storage Performance
July 2025 Performance | ERCOT
10/15/25
-
ERCOT Storage Performance
H1 2025 Performance | ERCOT
09/16/25
-
ERCOT Storage Performance
June 2025 Performance | ERCOT
09/16/25
-
ERCOT Storage Performance
May 2025 Performance | ERCOT
08/12/25
-
ERCOT Storage Performance
April 2025 Performance | ERCOT
07/15/25
-
ERCOT Storage Performance
Q1 2025 Performance | ERCOT
06/26/25
-
ERCOT Storage Performance
March 2025 Performance | ERCOT
06/17/25
-
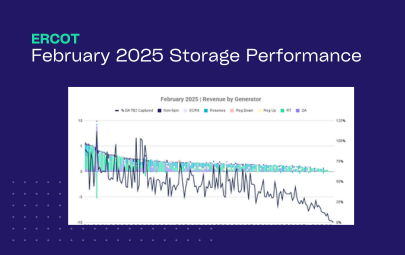
ERCOT Storage Performance
February 2025 Performance | ERCOT
05/13/25
-
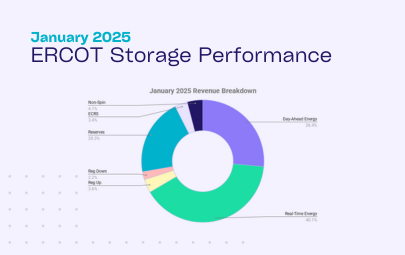
ERCOT Storage Performance
January 2025 Performance | ERCOT
04/28/25
-
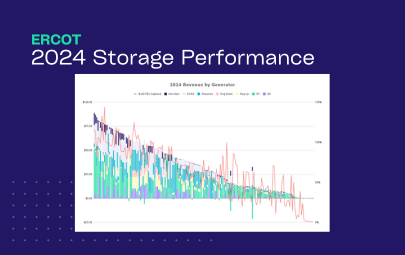
ERCOT Storage Performance
2024 Storage Performance | ERCOT
04/09/25
-

Guides
Benchmarking Energy Storage Performance in ERCOT: What Good Looks Like
02/24/25