ERCOT Storage Performance
ERCOT Storage Performance | 6 Months Post RTC+B
Looking back at storage asset operations and performance outcomes from 6 Months Post RTC+B.
Six months of data are in. December 2025 through May 2026 marks the first half-year of Real-Time Co-Optimization plus Batteries (RTC+B) – with a significant portion of time under their belts, how are storage operators fairing in this new market structure?
The median storage asset made $1.65/kW-month over that stretch, capturing just 58% of its available Day-Ahead TBx opportunity. Not exactly what most of the fleet was probably hoping for.
Six months in, this market is still hard to get right, even for the operators sitting on the biggest opportunity nodes.
Revenue overview
The highest earning asset saw outsized returns, 3.2x the median’s revenue. A large share of that gap traces to Winter Storm Fern, the largest event of the six month period and an event where Day-Ahead (DA) Energy saw significant premiums. Taking a DA position ahead of a storm that size took real conviction. Most of the fleet held out for Real-Time spikes that never fully materialized, while the assets willing to bid into the Day-Ahead Market instead came out ahead. Sixteen of the top 20 earners sit in ERCOT’s West Load Zone, the fleet’s most volatile. The pattern is clear. The assets that had both the conviction and higher-priced nodes were the ones that out-earned the rest of the fleet.
- Highest earning asset made $31.23/kW, while the top 50 revenue generators averaged $18.47/kW
- Median asset brought in $9.88/kW, with the fleet average higher at $10.39/kW
- Real-Time (RT) Energy made up the majority of revenue at 68%
Performance overview
The median captured 58% DA TBx over the six months. Exclude Winter Storm Fern, and it climbs to 19%. The fleet average, meanwhile, climbs about 15% under the same exclusion, as most assets missed the Day-Ahead opportunity specifically during that event. That tells us the middle isn’t performing as poorly as the top-level numbers suggest, there’s less dispersion across the fleet than the headline spread implies.
We define top performance by DA TBx capture – how much of the available Day-Ahead opportunity an asset captured at its duration (“x”) and node.
By that measure, the median performing asset left nearly half of DA revenue opportunity on the table. RTC+B asks for more decisions, faster, and staying agile is what separates the assets keeping up. Like the fleet, the top 20 performers made the majority of their revenue from RT Energy, at 55%, but layered on more. Ancillary Services (AS) made up a bigger share of their revenue than it did for the rest of the fleet, and DA AS alone accounted for 24%, more than double the 10% earners saw. That gap holds every month, top performers out-captured earners in DA AS share in all six months since RTC+B began. They leaned into DA AS hardest when the opportunity was there, capturing 50% of revenue from it in January alone, and pulled back just as fast when it wasn’t, staying flexible across products as conditions shifted.
- Top performing asset captured 143% of its DA TBx opportunity, and the top 50 averaged 87%.
- Median asset captured 58%, with the fleet average slightly lower at 57%.
Revenue mix
Across the fleet, RT Energy did the heavy lifting, making up 68% of revenue. AS made up 29%, with Reserves alone contributing 11%. DA Energy sat at just 3%, an average that hides real variation. Some operators took real DA Energy losses over the period, whether from charging more into DA Energy or calling DA vs. RT wrong.
Compared to the fleet, the top 20 earners leaned into RT Energy more, making up 71% of their revenue. The real separator was DA Energy. Top earners generated 12% of their revenue there, 4x the fleet’s share. Much of that traces back to Fern, top earners are sitting at the fleet’s most volatile nodes, and that’s where Fern’s DA Energy premiums were the greatest. But sitting on the biggest opportunity isn’t the same as capturing it. The top 20 earners averaged just 69% DA TBx capture, meaning even the assets making the most money left real value on the table.
The top 20 performers succeeded by staying diversified, pairing a still-majority Energy position with a much heavier AS layer that provides consistent capacity payments. It’s a safer, steadier bet, and it shows. The top 20 performers averaged 97% DA TBx, a wide enough gap that it’s likely part of why only two of the top 20 earners also rank in the top 20 performers.
Performance by duration
The more duration an asset has, the more room top performers find to differ from the fleet’s default mix. In the short-duration group, top 10 performers lean into AS at 48%, not far off the fleet’s 43%. By the long-duration group, top performers pull RT Energy down to 57%, well below the fleet’s 77%. Duration sets the baseline. What separates the best performers is how far they move from it.
RT Energy made up the majority of revenue across every duration group, and that share grew with duration. AS moved the opposite direction, stepping down with larger durations.
Breakdown by asset duration:
- Short duration assets (≤1.24 hours) leaned hardest into AS, 43% of revenue. The top 10 performers push that even further, to 48%, driven mainly by a jump in RT AS. With less energy to hold, AS is the natural home for this group’s revenue.
- Mid-duration assets (1.25–1.74 hours) leaned on RT Energy for the majority of revenue, at 64%. The top 10 performers diversify a bit further, leaning less on RT Energy, down to 49%, and picking up more DA Energy, up to 8%. More duration means more room to hold energy into the Day-Ahead window.
- Long duration assets (>1.75 hours) saw the largest portion on revenue from RT Energy, the fullest of any group, at 77%. The top 10 performers diversify even more, leaning less into RT Energy, down to 57%, and picking up more DA Energy and AS instead, DA Energy climbs to 12%, the highest of any duration group. With the most capacity of the three, they have the most room to make that shift.
Interesting days
Not every day carried equal weight over these six months. A handful of days accounted for an outsized portion of total revenue, and the rest of the period moved quietly by comparison.
- Winter Storm Fern (January 24-26): Nothing else in the six months came close to the returns storage assets were able to generate in this period. The fleet’s highest earners made the majority of their revenue in this three-day window alone.
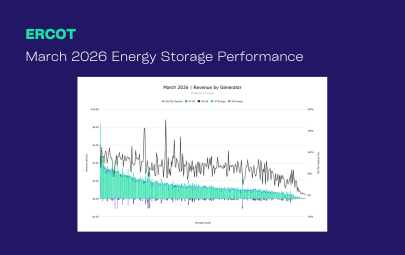
- March 23: One day did the work of a normal month. A RT Energy spike on March 23 alone made up 20% of the fleet’s entire March revenue.
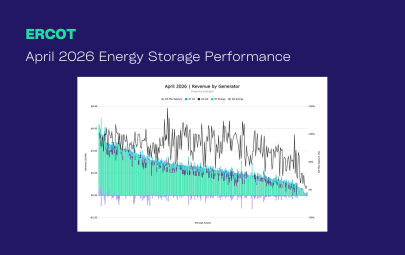
- April 24: Spring brought its own outlier. RT Energy hit $1,000/MWh and RT Non-Spin cleared at $200/MWh, making this one of the sharpest single-day price events of the period.
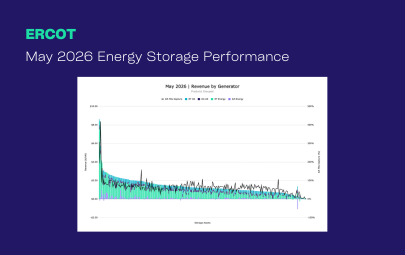
- May 26: RT Energy spiked to $280/MWh well past the usual evening peak, and the fleet’s top earner chased it while the top performer went all-in on Ancillary Services instead, capturing 673% of its DA TBx opportunity in the process.
*Top earners defined as highest $/kW
**Top performers defined as highest percent of DA TBx captured
-
ERCOT Storage Performance
May 2026 Performance | ERCOT
08/11/26
-
ERCOT Storage Performance
Q1 2026 Performance | ERCOT
06/16/26
-
ERCOT Storage Performance
April 2026 Performance | ERCOT
07/14/26
-
ERCOT Storage Performance
March 2026 Performance | ERCOT
06/11/26
-
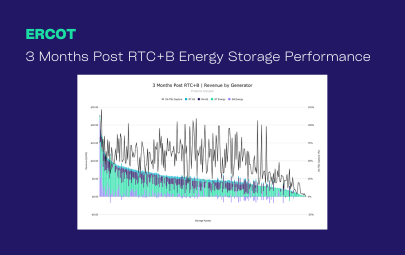
ERCOT Storage Performance
3 Months Post RTC+B Performance | ERCOT
05/20/26
-
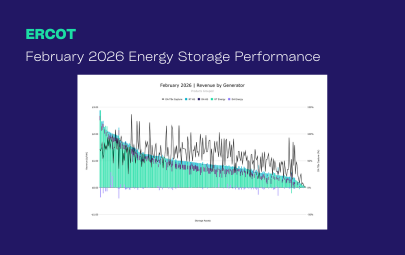
ERCOT Storage Performance
February 2026 Performance | ERCOT
05/14/26
-
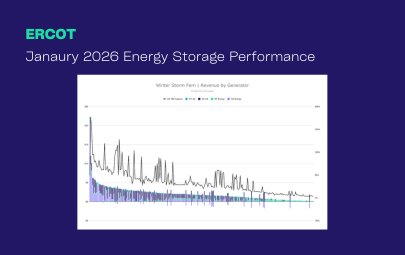
ERCOT Storage Performance
January 2026 Performance | ERCOT
04/16/26
-
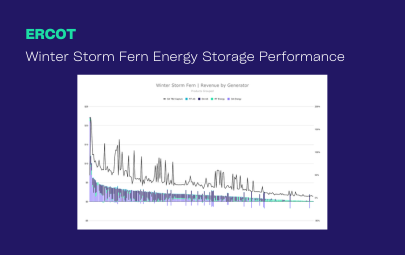
ERCOT Storage Performance
Winter Storm Fern Performance | ERCOT
04/16/26
-
ERCOT Storage Performance
December 2025 Performance | ERCOT
03/20/26
-
Case Studies
Capturing ERCOT’s first post-RTC+B price spike
12/22/25
-
ERCOT Storage Performance
November 2025 Performance | ERCOT
02/18/26
-
ERCOT Storage Performance
October 2025 Performance | ERCOT
01/14/26
-
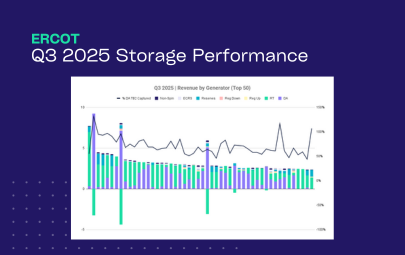
ERCOT Storage Performance
Q3 2025 Performance | ERCOT
12/16/25
-
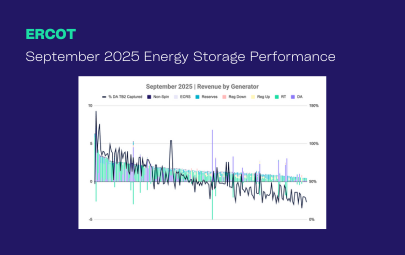
ERCOT Storage Performance
September 2025 Performance | ERCOT
12/15/25
-
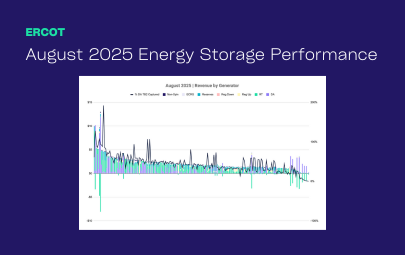
ERCOT Storage Performance
August 2025 Performance | ERCOT
11/19/25
-
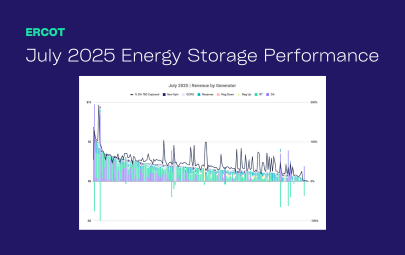
ERCOT Storage Performance
July 2025 Performance | ERCOT
10/15/25
-
ERCOT Storage Performance
H1 2025 Performance | ERCOT
09/16/25
-
ERCOT Storage Performance
June 2025 Performance | ERCOT
09/16/25
-
ERCOT Storage Performance
May 2025 Performance | ERCOT
08/12/25
-
ERCOT Storage Performance
April 2025 Performance | ERCOT
07/15/25
-
ERCOT Storage Performance
Q1 2025 Performance | ERCOT
06/26/25
-
ERCOT Storage Performance
March 2025 Performance | ERCOT
06/17/25
-
ERCOT Storage Performance
February 2025 Performance | ERCOT
05/13/25
-
ERCOT Storage Performance
January 2025 Performance | ERCOT
04/28/25
-
ERCOT Storage Performance
2024 Storage Performance | ERCOT
04/09/25
-

Guides
Benchmarking Energy Storage Performance in ERCOT: What Good Looks Like
02/24/25