ERCOT Storage Performance
ERCOT Storage Performance | Q1 2026
Looking back at storage asset operations and performance outcomes from Q1 2026.
The first quarter of 2026 rewarded ERCOT energy storage assets that stayed agile, called the right premiums, and had forecasting tuned to their node. Winter Storm Fern was the quarter’s defining pricing event, with March 23 the only other standout. For the rest of the quarter, the market was calm. That made execution in the right moments everything.
Revenue overview
Winter Storm Fern accounted for 33% of the quarter’s revenue. The top earners were positioned to capture it, but converting the winter storm price volatility into realized revenue took more than being at the right node. Going heavy into DA Energy during a storm event of that magnitude is a conviction call. The operators who made it, and had the forecasting and execution to back it up, earned their Q1 results.
RTM revenue grew its share month-over-month through the quarter, a trend worth watching as RTC+B continues to reshape how operators position across products. The median revenue is up 6% year-over-year as well, but the divergence between top and middle is still wide. The upside for operators with sharp bidding strategy, reliable forecasting, strong conviction, and real-time responsiveness remains significant.
- Highest earning asset made $22.70/kW, while the top 50 revenue generators averaged $10.48/kW
- Median asset brought in $5.34/kW, with the fleet average higher at $5.65/kW
Performance overview
Revenue tells you what an asset earned. DA TBx capture rate tells you how well it earned it.
We define top performance by DA TBx capture — how much of the available Day-Ahead opportunity an asset captured at its duration (‘x’) and node.
Strip out the differences in nodal pricing and duration across the fleet, and you’re left with a clean read on execution.
By that measure, Q1 showed real progress. DA TBx capture rates improved month-over-month – a signal that operators are learning. Nine assets crossed 100% DA TBx capture, with several getting there by consistently improving as the quarter progressed, running proactive, diversified bidding strategies. The fleet average followed the same upward trend month-over-month. But at 52%, nearly half the available opportunity is still being left on the table. The path forward is to keep adapting with the same agility and proactive approach that got the top operators above 100%.
- Top performing asset captured 118% of its DA TBx opportunity, and the top 50 averaged 87%
- Average and median asset captured 52%
Revenue mix
RT Energy carried the majority of revenue across every group in Q1 — fleet average, top earners, and top performers alike. The top 20 earners leaned heavily into DA Energy with 21% of their revenue stack vs. 6% for the fleet average. The top 20 performers looked different with RT Energy still leading at 43%, but DA AS made up 36%, a significantly higher % than the top earners and fleet average. Where top earners concentrated in energy, top performers spread across products, staying diversified and capturing value wherever it surfaced.
Looking across Q1’s top two performing operators (measured by DA TBx capture), we examined how their strategies evolved month-over-month. A wide range of approaches can succeed, but only when they align with nodal realities.
The #1 performer operated on the West Load Zone. January was exceptional – 82% of the quarter’s revenue came from a single month, driven by Winter Storm Fern. Strong nodal pricing and the conviction to execute on it produced an outsized result. But February and March told a different story. DA TBx capture rates dropped sharply, and revenue followed. Getting Fern right was a real achievement. Sustaining that level of performance requires continuous adaptation, and without it, the results slip.
The #2 performer, in the South Load Zone, took the opposite trajectory. January was a modest DA TBx capture rate. What followed was a quarter of steady improvement. DA TBx capture rates climbing month-over-month, RT Energy revenue growing alongside it, with Ancillary Services consistently contributing throughout. No single explosive event. Just a progressively sharper read on the market and the execution to act on it.
Two operators, two different operating strategies. That variability speaks to just how node-specific ERCOT really is, and why no single playbook guarantees success.

Performance by duration
The pattern holds across every duration class. As assets get longer, DA AS revenue shrinks and RT Energy grows.
Breakdown by asset duration:
- Short duration assets (≤1.24 hours) saw the fleet post modest positive DA Energy revenue while the top 10 ran negative, meaning they either called the price premium wrong or charged into DA Energy. The top 10 made up for it with a significantly larger DA AS share. With limited discharge capacity, AS commitment is the natural fit as it generates revenue without burning through state of charge before a better opportunity arrives.
- Mid-duration assets (1.25–1.74 hours) showed the top 10 rotating meaningfully away from RT Energy and toward DA Energy compared to the fleet. The consistent DA premium throughout Q1 rewarded operators who committed to the Day-Ahead, and the top performers in this tier recognized it.
- Long duration assets (>1.75 hours) amplified the same pattern. The fleet leaned heavily on RT Energy. The top 10 pulled significantly more from DA Energy, giving up RT optionality in favor of Day-Ahead commitment. More energy capacity to deploy means more opportunity to capture the DA premium.
Interesting days
Revenue wasn’t evenly distributed across Q1. Outside of Winter Storm Fern and a single day in March, the quarter was largely calm.
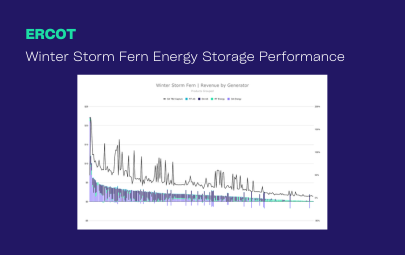
- Winter Storm Fern (January 24-26): The dominant event of the quarter. The top revenue-generating days all clustered in this window, with the storm and the days surrounding it driving the majority of Q1 earnings for the fleet’s highest earners.
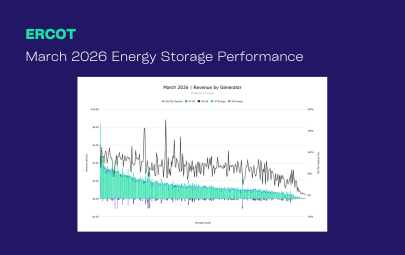
- March 23: The standout day outside of Fern. A Real-Time Energy spike on March 23 accounted for 20% of total fleet revenue for the month of March.
*Top earners defined as highest $/kW
**Top performers defined as highest percent of DA TBx captured
-
ERCOT Storage Performance
March 2026 Performance | ERCOT
06/11/26
-
ERCOT Storage Performance
February 2026 Performance | ERCOT
05/14/26
-

ERCOT Storage Performance
January 2026 Performance | ERCOT
04/16/26
-
ERCOT Storage Performance
Winter Storm Fern Performance | ERCOT
04/16/26
-
ERCOT Storage Performance
December 2025 Performance | ERCOT
03/20/26
-
Case Studies
Capturing ERCOT’s first post-RTC+B price spike
12/22/25
-
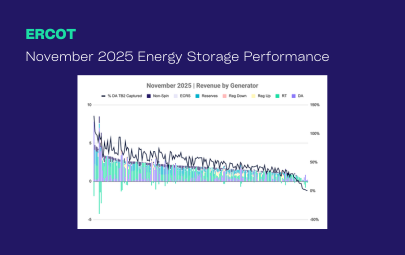
ERCOT Storage Performance
November 2025 Performance | ERCOT
02/18/26
-
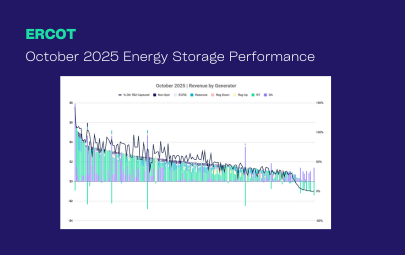
ERCOT Storage Performance
October 2025 Performance | ERCOT
01/14/26
-
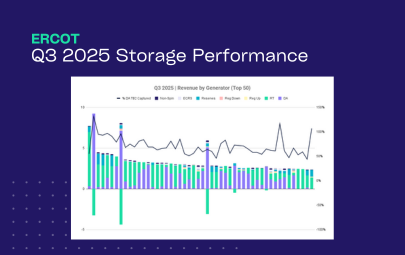
ERCOT Storage Performance
Q3 2025 Performance | ERCOT
12/16/25
-
ERCOT Storage Performance
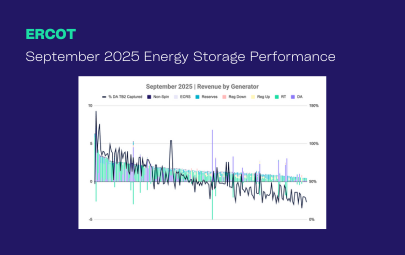
September 2025 Performance | ERCOT
12/15/25
-
ERCOT Storage Performance
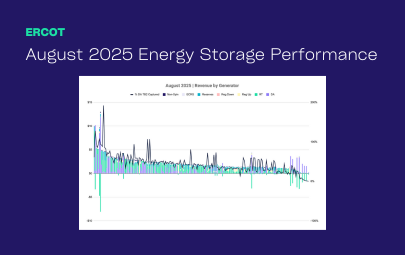
August 2025 Performance | ERCOT
11/19/25
-
ERCOT Storage Performance
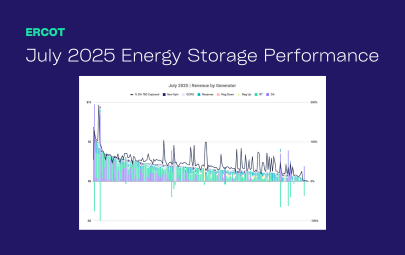
July 2025 Performance | ERCOT
10/15/25
-
ERCOT Storage Performance
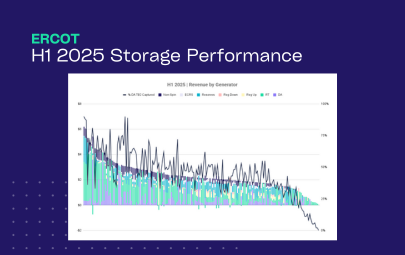
H1 2025 Performance | ERCOT
09/16/25
-
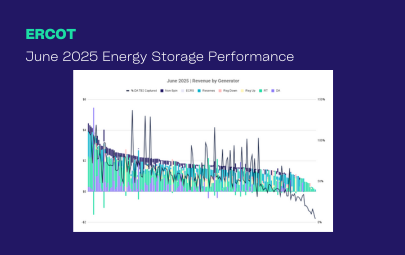
ERCOT Storage Performance
June 2025 Performance | ERCOT
09/16/25
-
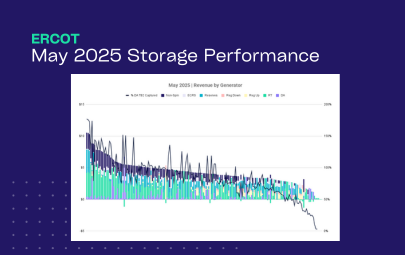
ERCOT Storage Performance
May 2025 Performance | ERCOT
08/12/25
-
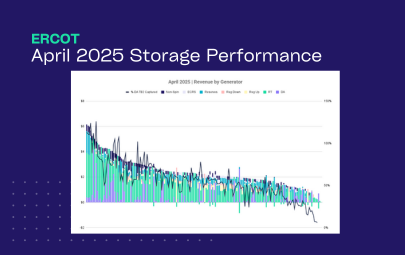
ERCOT Storage Performance
April 2025 Performance | ERCOT
07/15/25
-
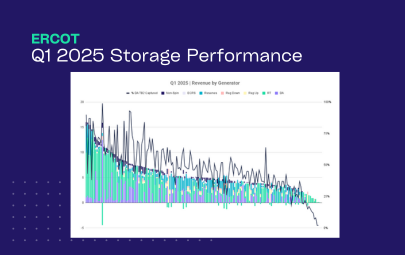
ERCOT Storage Performance
Q1 2025 Performance | ERCOT
06/26/25
-
ERCOT Storage Performance
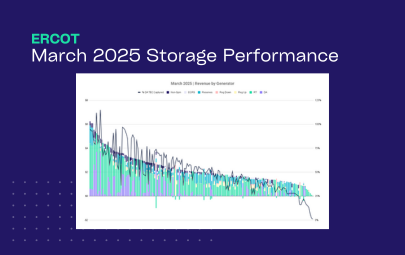
March 2025 Performance | ERCOT
06/17/25
-
ERCOT Storage Performance
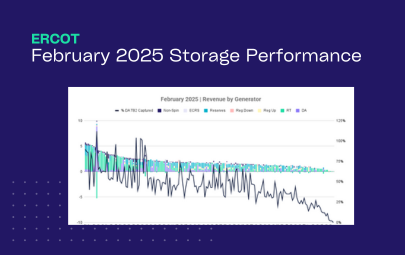
February 2025 Performance | ERCOT
05/13/25
-
ERCOT Storage Performance
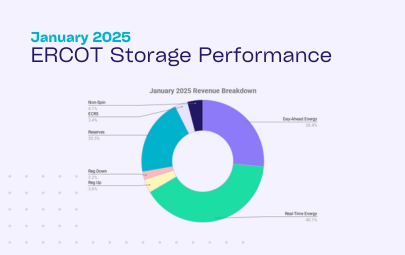
January 2025 Performance | ERCOT
04/28/25
-
ERCOT Storage Performance
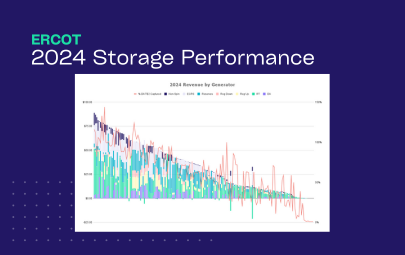
2024 Storage Performance | ERCOT
04/09/25
-

Guides
Benchmarking Energy Storage Performance in ERCOT: What Good Looks Like
02/24/25