ERCOT Storage Performance
ERCOT Storage Performance | January 2025
Looking back at storage asset operations and performance outcomes from January 2025.
For the most part, 2025 started the way 2024 ended. Total revenue opportunity was relatively low, and the majority of earnings were concentrated in Real-Time (RT) energy. The month did show one subtle, but meaningful shift – Day-Ahead (DA) energy is beginning to comprise more of the revenue stack than Ancillary Services (AS).
Performance Overview
Storage assets across ERCOT earned an average of $1.59/kW in January. The median asset made $1.31/kW, suggesting that the upper half of performers lifted the average more than the lower half dragged it down.
This trend is underscored by the top revenue generating battery, which made $8.16/kW – and 90% of which was in RT energy. This asset was an extreme outlier as the next-highest asset came in at $5.72/kW, and the top 20 performers averaged $3.79/kW. The takeaway: high volatility at a few select nodes continues to drive disproportionate gains for well-located — or lucky — assets.
Across the fleet, Real-Time energy was the primary revenue driver. Battery Energy Storage Systems (BESS) made 40% of total revenue in RT, while the top 20 assets earned 78% of theirs from RT energy.
Given how much of total revenue is tied to nodal volatility, it is more accurate to benchmark performance – and by performance we mean how optimally a battery operated – by the percent of the DA TB2 they were able to capture.
In January, the average percent of DA TB2 captured was 47%, with the median at 44%. This was up from December, but still not the performance most operators strive for. A few operators did have a good month, with the top operator capturing 105% of their DA TB2, and the top 20 averaging 83%.
Of those top 20 performers, 72% of revenue was from Real-Time energy.
Shifting Revenue Mix
Emergence of Day-Ahead Energy
Perhaps the most interesting development in January was the evolving revenue mix. Day-Ahead Energy has significantly increased its share of the revenue stack – while Ancillary Services (AS) is on the decline.
In January, DA accounted for 26% of total revenue (up from 9% in 2024), while AS products combined contributed 33% — with 20% of that coming from Reserves. For comparison, AS has historically been the core source of predictable income for many assets, and accounted for 65% of all revenue made in 2024.
This shift toward DA energy as a critical revenue stream introduces new operational challenges. Committing to DA:
- Introduces delivery risk
- Can limit/remove optionality to capitalize on more lucrative RT spikes should they arise
For this reason, accurate forecasts and an ability to develop a DAM bidding strategy that is unique and sets you up for success each day is key.
As we see DA emerge, it is important to interrogate how operators are handling it from a risk management perspective. We unpack the risks associated with Day-Ahead energy – and how operators are managing this risk (or not) in this deep dive.
Interesting Day Deep Dives
January 6, 2025
On January 6th, the top revenue generating asset of the month had its best day of the month, which is actually somewhat remarkable given it missed the majority of a morning spike where prices remained around $2.8K for close to four hours.
Rather, the asset netted $1.30/kW, largely due to selling into moderately high prices (~$600-700) in the evening hours. This day is representative of why the asset was made to capture so much more revenue than peers throughout the month. Located at a highly volatile node, it is able to sell into prices that are significantly higher than the norm.
In comparison, other assets that did well grossed $0.36/kW and $0.27/kW respectively – but these assets actually sold into the peak hours at their nodes. Their nodes, though, capped out between ~$200-400 on the day.
January 15, 2024
January 15th is also worth digging into as it was the top grossing operating day for a number of assets across ERCOT, but our month’s #1 asset completely missed.
What happened?
The month’s top revenue generating asset missed the Real-Time energy price spike, which peaked with prices just over $3,000 in the 7am hour, but also had prices between $1,000-$2,000 consistently from midnight-3am.
While we don’t know for certain, this behavior implies that the asset had no or low SOC, inhibiting it from selling into these elevated prices.
The asset charged up shortly after the spike, and then was inactive the remainder of the day, which resulted in a cumulative revenue of -$0.05/kW.
Other assets were much more effective at preparing for – then selling into the RT energy peak. This, unsurprisingly, resulted in superior revenue outcomes. The below asset, for example, hit the ~$2,500 price peak at 7am, and ended the day at $1.31/kW.
The bar for operational excellence in ERCOT continues to rise. Top performers are capturing value through smarter, more adaptive strategies that leverage all available products – and are able to determine the right product at the right time. For this reason, forecasting and flexibility are now mission-critical tools, not just nice-to-haves. The ability to confidently participate in the DAM without missing RT upside will separate good operators from great ones.
-
ERCOT Storage Performance
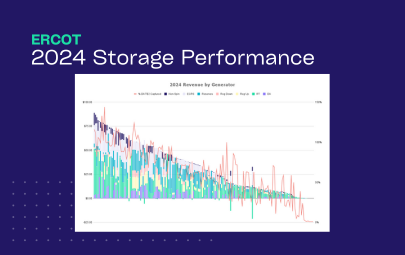
2024 Storage Performance | ERCOT
04/09/25
-

ERCOT Storage Performance
December 2024 Performance | ERCOT
03/17/25
-

ERCOT Storage Performance
November 2024 Performance | ERCOT
02/24/25
-

Guides
Benchmarking Energy Storage Performance in ERCOT: What Good Looks Like
02/24/25
-

Case Studies
Maximizing Revenue in ERCOT’s West Load Zone
12/31/24