ERCOT Storage Performance
ERCOT Storage Performance | November 2024
Looking back to storage asset operations and performance outcomes from November 2024.
In November 2024, for the first time in ERCOT, the majority of battery revenue came from Real-Time Energy.
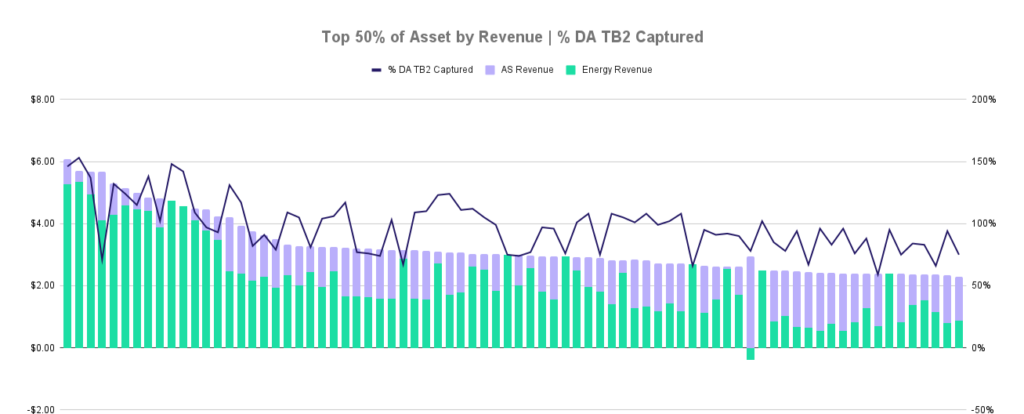
Using ERCOT’s 60-day disclosure data to understand how assets across the fleet are operating, and which approaches perform the best, we can clearly see that the assets with the highest net revenue made the vast majority of their revenue from Real-Time Energy. And these top performers made ~2x the revenue of median performers ($/kW).
With the shift to energy arbitrage being the primary revenue driver, a metric that is perhaps more descriptive of operating effectiveness, is how much of the available revenue opportunity an asset was able to capture. To quantify this, we look at the percent of TB2 (difference between the top two price hours and the bottom two priced hours) that an asset captured.
Intuition behind this metric:
Since each node has different prices, being at a more volatile node naturally makes the revenue opportunity higher (because there will be higher highs, and/or lower lows). An asset’s ability to capitalize on the opportunity available is more indicative of how well they perform since it normalizes for volatility. Basically, it removes the element of ‘we made more money because we built our asset in a good place.’
When we zoom in on the top 50% of storage assets (by total revenue), we see some assets that initially appeared to be “top performers,” can’t actually attribute their outcomes to optimal performance. In fact, some left a lot of revenue on the table.
Optimal operations means capturing the most of the available opportunity. Those that best capitalized on November’s opportunity did so by embracing energy arbitrage. One reason for this is that much of November’s revenue opportunity was concentrated on two key days – November 10th and 17th – where prices hit quadruple digits across zones.
Operating Strategy | High Revenue Day Deep Dive
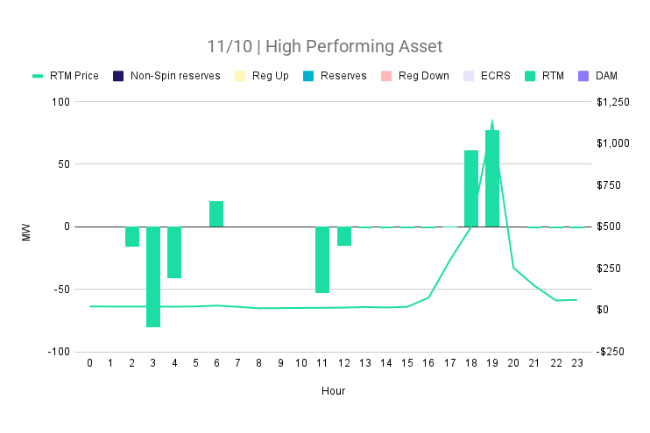
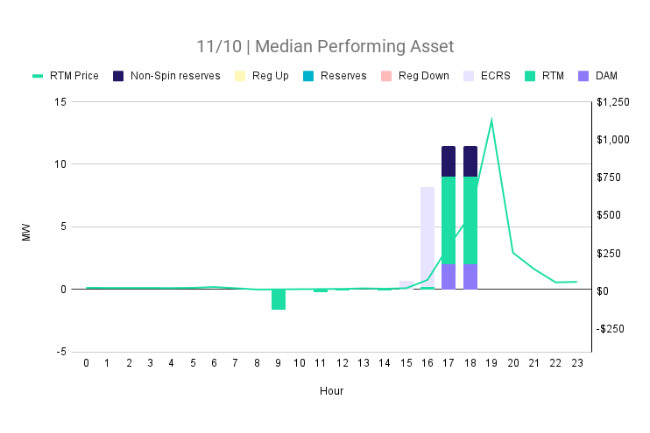
When we look closely at the operating strategies of top and median performing storage assets on these two days, it is clear that those that captured the most revenue did so via Real-Time Energy.
On both days, the highest revenue generating assets forecasted and prepared for the RT price spike, ensuring little to no capacity was allocated to Ancillary Services.
November 10th
Operating strategy comparison:
The highest revenue generating assets forecasted and prepared for the late evening price spike, ensuring little to no capacity was allocated to Ancillary Services.
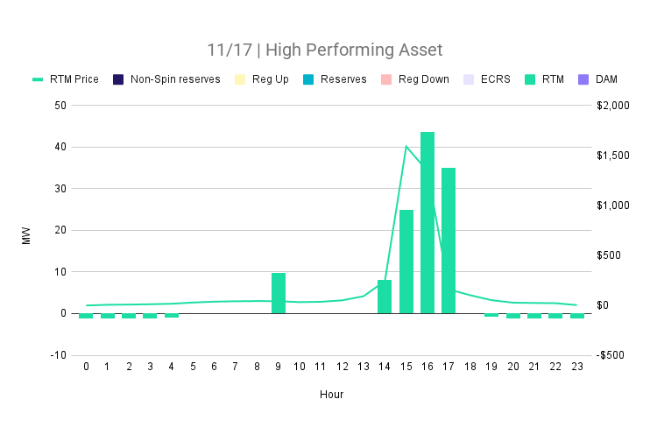
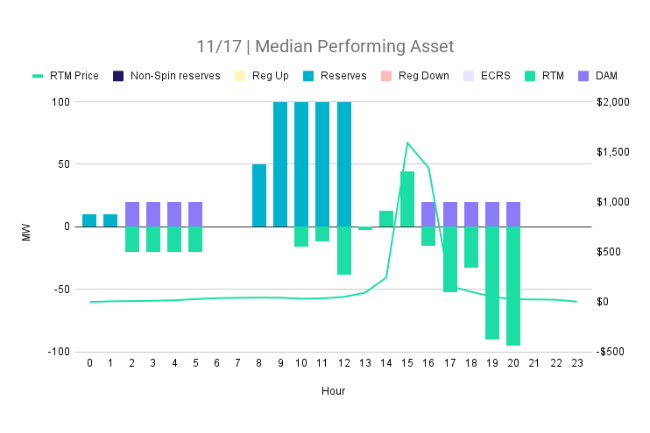
November 17th
Operating strategy comparison:
Similarly, the highest revenue generating assets planned for, then maximized discharge into, the Real-Time Energy price spike.
Looking at the strategies of these top performers – and comparing them to the approaches of median and low performing assets – makes it clear just how important it is to have accurate forecasts, and the agility to adjust your operating plan in real-time. On these big days, discharging too early, or allocating capacity to AS/DA energy have six figure+ ramifications for operators.
-

Guides
Benchmarking Energy Storage Performance in ERCOT: What Good Looks Like
02/24/25
-

Case Studies
Asset Cycling Optimization for Revenue Maximization
09/16/24
-
Case Studies
ERCOT: Breaking down the November 10th price spike
11/14/24
-

Case Studies
Maximizing Revenue in ERCOT’s West Load Zone
12/31/24