Guides
Managing Risk with Day-Ahead Energy Bidding
Day-Ahead energy bidding presents a great revenue opportunity for energy storage operators to capture incremental upside — but only when paired with disciplined risk management.
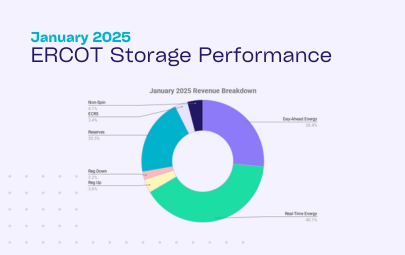
In January, we began to see many more operators making revenue from Day-Ahead (DA) energy. In fact, DA energy represented 26% of total revenue generated by storage assets – up from 9% in 2024.
DA energy can have substantial upside for operators. It provides a reliable revenue stream and is often associated with higher clearing prices. In fact, in January we saw DA energy clear higher than RT in:
- 56% of all hours
- 68% of morning peak hours (6-8am)
- 55% of evening peak hours (5-8pm)
Energy storage operators able to forecast the higher clearing hours can increase revenue outcomes by leveraging this product – but it doesn’t come without risk.
Why is DA energy a tough optimization problem?
A combination of uncertainty and risk make bidding into the DA energy market a complex optimization problem.
- DA energy bids are submitted at 10am day n-1, so you don’t have full visibility into a number of key variables such as the exact state of charge (SOC) of the battery and the real time conditions of the grid. For this reason, you need to plan for all contingencies.
- You have to account for all risk parameters – ranging from desired coverage, Real-Time (RT) Energy price exposure, and more. More on this below.
Risks associated with Day-Ahead energy
[1] Delivery risk
Once your DA energy bid clears, you have a financial (but not operationally binding) position in the market. If you do not cover your DA energy position through actual assets operations, you are exposed to the corresponding RT energy price for that given period.
If RT energy prices are low, it isn’t a big deal to buy out of the obligation – and can even be advantageous as you can make money without having to cycle the battery. But in instances where the RT energy prices are higher than what you received for the DA energy offer, you would lose money.
Example: You offer 100MW into DA energy at 5pm and clear at $100/MWh
- Scenario 1 | Cover position through operations: You discharge during the 5-6pm window, collect the $100/MWh, and have no RT energy exposure.
- Scenario 2 | DART trade opportunity: RT energy prices are down at $20/MWh, so you chose to pay the $20/MWh. Having already collected the $100/MWh for your DA energy position, you net $80/MWh without having to operate.
- Scenario 3 | Non-delivery: RT energy prices had been high in the preceding hours and remain high, say around $400/MWh. For the sake of easy math, let’s say your battery is completely empty and you do not cover your DA energy position. You would now need to pay the $400/MWh RT energy price, and would lose $300/MWh on the hour.
[2] Limited flexibility
Once you have cleared into DA energy, it restricts your ability to then take advantage of the RT energy market. For example, if you cleared the full capacity of your battery in DA energy for an hour interval where RT energy prices take off, you would not have the ability to capture RT upside that hour.
How are operators managing their risk?
Using the January 60 day disclosure data, we looked into how operators with DA energy as a large percentage of their revenue stack are managing the risk – or not.
- What we found: The higher performing operators – measured by capturing a higher percent of the DA TB2 – did a better job delivering on their obligations.
- Why this is the case: By delivering on their obligations, the higher performing assets are not subject to losses (that can outweigh the gains from DA) from having to buy out of their obligations at the RT price.
- How we can tell: In the operating day deep dive below, when you see negative RT energy (green bar) paired with DA energy (purple bar) it implies the operator had to buy out of their obligation at a RT energy price that was higher than the DA energy price and/or was exposed to RT energy charging costs.
Operating day deep dive
Finally, we zoomed in on a median performing asset overall, but one of the top performers in the Houston Load Zone.
- Captured 62% of the DA TB2
- Generated $1.46/kW
January 20, 2025 | Worst performance of the month
On January 20th, this energy storage resource cleared DA energy sales in the morning (3-5am, 7-9am) and early afternoon (11am-2pm). Given the multi-hour space between each DA energy sale block, the asset could theoretically cover each position from physical operations. However, the operator only covered the 7-9am block. At his time, DA prices were actually lower than RT energy prices at this time, clearing around $65-75/MWh. Given the differential, the asset missed an opportunity to capitalize on the DA/RT spread without dispatching.
RT energy prices were also higher than DA energy during the intervals when the asset did not cover its obligations (3-5am and 11am-2pm), so it was exposed to covering its position by buying back at higher RT energy prices and taking a loss. In addition, the asset actually charged in RT 3-5am and 11am-2pm exacerbating the DA/RT trade loss.
All-in-all, the asset ended the day with $0.18/kW loss.
January 21, 2025 | Best performance of the month
The very next day, this asset had similar market awards, and again discharged from 7-9am. However, on this day, DA energy prices cleared at ~$162 and $144/MWh – meaning the same operating strategy yielded higher revenue. The asset also charged back up at lower mid-day prices, enabling a second discharge into ~$80-88/MWh RT prices later in the evening.
This results in $0.41/kW on the day.
Given that on January 20th, this asset’s last activity was charging, we can assume that it entered the operating day with a high state of charge (SOC). This also contributes to the higher cumulative revenue on the day since it eliminates one buying cycle.
Managing risk
While effective optimizers should be able to forecast spreads (DA vs. RT energy prices across hours), and manage risk/deliverability, there are also levers the operators can pull, if desired. For Tyba, this can happen directly in our platform.
A few examples include:
- Tiered DA energy bidding
ERCOT allows for multi-leg, tiered bidding for DA energy. With this, you can structure bids so that you only commit additional MW/MWhs into DA energy as prices reach certain thresholds.More details on how multi-leg bidding works can be found on our Dynamic PQ bidding overview >>
- DA energy price floor / ceiling
This means inputting the lowest price at which you would be willing to sell DA energy (discharge), and highest price at which you would be willing to buy DA energy (charge) respectively.Trading teams may use this, for example, if they have a perspective that RT energy will be clearing above a certain price on a certain day and they want to hold capacity or clear higher.
- Capacity limits
This configurable assumption enables operators to limit the total amount of capacity available to bid into DA energy. One may limit bidding on DA energy if, for example, they believe it will be a volatile summer and, for the months of June-August they never want more than 50% of their capacity committed. This way, no matter when a RT energy price spike occurs, they should have operational flexibility to sell into it. - Hurdle rates
This represents the price spread required to cycle your battery, and can inhibit going after small opportunities. One may, for example, set a $20 hurdle rate – effectively telling the optimizer that the price at which we are willing to see energy must be at least $20 higher than the price at which we will be able to buy it.
All of these parameters – and more – can be controlled in Tyba’s platform by operators that want to take a more hands on approach.
Day-Ahead energy bidding presents a great revenue opportunity for energy storage operators to capture incremental upside — but only when paired with disciplined risk management. The difference between high- and low-performing assets often comes down to execution: the ability to forecast price spreads, deliver on commitments (or take advantage of the arbitrage opportunities presented), and maintain flexibility for Real-Time upside. Getting this right is increasingly important as revenue streams continue to evolve — and particularly in shoulder seasons where we are seeing a growing share of days where DA energy prices clear higher than RT in peak hours.
-
ERCOT Storage Performance
January 2025 Performance | ERCOT
04/28/25
-
ERCOT Storage Performance
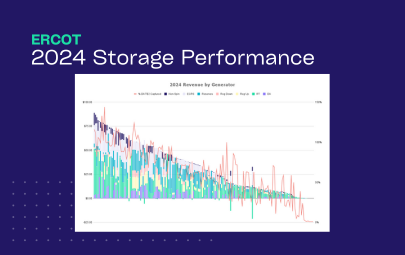
2024 Storage Performance | ERCOT
04/09/25
-

Guides
Benchmarking Energy Storage Performance in ERCOT: What Good Looks Like
02/24/25
-

Guides
Five watch-outs during the go-live process – and how to pre-empt them
04/24/25