ERCOT Storage Performance
ERCOT Storage Performance | Q1 2025
Looking back at storage asset operations and performance outcomes from Q1 2025.
The first quarter of 2025 delivered meaningful returns for a handful ERCOT energy storage assets — but more importantly, it revealed just how much value remains untapped.
The top revenue generator earned more than 3x the median asset – and the top performing asset captured about 2x the DA TB2 of the median.
- Top revenue generator net $16.06/kW, and captured 73% of DA TB2
- Top 20 earners averaged $12.48, and only captured an average of 56% of their DA TB2
- Median asset came in at $5.03/kW

Fleet overview
Even among top energy storage performers, the gap between revenue and performance efficacy is striking. The top 20 revenue generators only captured, on average, 56% of their DA TB2, meaning almost half of their revenue opportunity was left on the table.
This points to a key takeaway: many of the highest earners are riding nodal volatility rather than consistently executing high-performing strategies. The opportunity to close that gap remains wide open.
Performance overview
When zooming in on performance, it is clear that Q1 was suboptimal across much of the ERCOT storage fleet. The median asset captured just 46% of their DA TB2 – and no asset beat their DA TB2. While the shift to energy arbitrage as a primary revenue driver does make it more difficult to achieve high performance because RT price spikes are both harder to predict and capture – these numbers still leave most wanting.
- Top performing asset captured 99% of their DA TB2
- Top 20 performers averaged 81% DA TB2 capture
- Median captured 46% of its DA TB2
We also saw a wide distribution in performance. The standard deviation in TB2 capture across the fleet was just over 18%. That level of spread reflects meaningful inconsistency in how well operators are converting market opportunity into actual results.
And while Real-Time (RT) energy was the dominant revenue driver for many of the highest-earning and top performing assets, layering on other products — particularly Day-Ahead energy and Reserves — proved essential to achieving strong outcomes. The top performers weren’t just counting on RT volatility, they were executing more proactive and diversified bidding strategies.
Operating strategy takeaways
In Q1’25, RT energy made up the largest share of revenue at 43%, while ERCOT Ancillary Services (AS) contributed 35%, more than half of which came from Reserves. This is in stark contrast to Q1’24 where 83% of revenue came from AS.
Isolating to the top revenue generators, energy storage assets brought in ~65% of their revenue from RT energy – about 1.5x the average. This concentration suggests that the assets with top revenue outcomes bet on price spikes, and benefitted from nodal volatility. In contrast, the top performing (highest TB2 capture) battery energy storage systems more proactively layered in DA energy and AS to capture more of the revenue opportunity available to them.
What can we take away from this? Operators at more volatile nodes tend to reserve more capacity for RT. While this can be an effective strategy in periods with large RT spreads, prices were comparatively stable in Q1 – and many of the highest energy price spikes were in DA energy.
Interesting day deep dives
While overall volatility in Q1 was somewhat muted, a few standout days offered clear windows into what strong — and flawed — strategy can look like in practice. It’s worth zooming in on two of them.
February 20, 2025
February 20th stood out as the most lucrative day of the quarter, accounting for nearly 10% of all ERCOT energy storage revenue in Q1 and delivering roughly 9x the average daily revenue across the fleet.
The market experienced high Day-Ahead (DA) energy prices – clearing over $900 in the 6am and 7am hours – driven by ERCOT’s need to secure resources amid extreme cold, high demand forecasts (80GW+), and limited renewable generation before the morning ramp.
At that time, RT energy was clearing around $300, and most ‘up’ AS products were ~$100, making DA energy the clear winner for those who had positioned themselves strategically in the Day-Ahead Market (DAM).
The operating strategy of the North Load Zone’s top performing asset represents a high achieving approach – helping them bring in $1.29/kW, with 73% in DA energy.
This asset:
- Cleared the majority of its capacity in DA energy, locking in peak value in the highest-priced hours
- Dispatched remaining capacity in RT energy to capture elevated (though lower) morning prices
- Capped off the day selling RT energy in the evening when prices rebounded a bit, clearing around $140
January 19, 2025
We often focus on the high revenue days, but as anyone operating storage knows – avoiding large losses is also key to strong outcomes. On January 19th, we can see that a number of battery storage assets – including consistently high revenue generators – took a hit.
Let’s dive into what happened, and how such risk could’ve been avoided.
One example comes from the asset with the second highest revenue – though, #104 in terms of performance only capturing 43% of their DA TB2 – of the quarter. On January 19th, the energy storage system made $0.02/kW in revenue despite DA energy prices reaching over $330/MWh at its node.
The battery’s operating strategy can help explain this outcome:
- As it did on almost every operating day, the asset cleared RRS awards across the majority of hours, likely planning to collect capacity payments, not get dispatched, and sell into RT energy when prices warranted.
- Its approach — like many of the top revenue generators — is heavily reliant on RT energy, with little or no participation in the DA market.
- On this particular day, DA energy was the only product offering outsized value — yet the asset wasn’t positioned to take advantage of it.
- This lack of daily customization and strategic agility came back to haunt them on this day where DA energy was the only product with compelling prices.
Q1’25 shows just how much market dynamics have evolved in ERCOT. Ancillary Services contribute fairly minimally to the revenue stack, top earners are leaving significant value on the table, and wide performance spread reinforce that adaptability — not just volatility — is what sets the best strategies apart. As the market continues to adjust, so must the operators aiming to lead it.
-
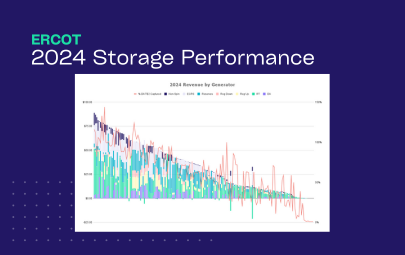
ERCOT Storage Performance
2024 Storage Performance | ERCOT
04/09/25
-
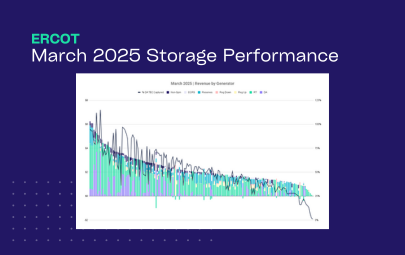
ERCOT Storage Performance
March 2025 Performance | ERCOT
06/17/25
-
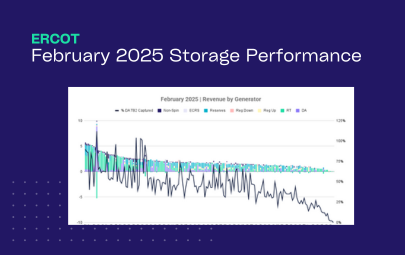
ERCOT Storage Performance
February 2025 Performance | ERCOT
05/13/25
-
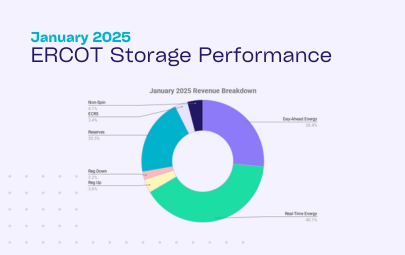
ERCOT Storage Performance
January 2025 Performance | ERCOT
04/28/25
-

ERCOT Storage Performance
December 2024 Performance | ERCOT
03/17/25
-

ERCOT Storage Performance
November 2024 Performance | ERCOT
02/24/25
-

Guides
Benchmarking Energy Storage Performance in ERCOT: What Good Looks Like
02/24/25