ERCOT Storage Performance
ERCOT Storage Performance | February 2025
Looking back at storage asset operations and performance outcomes from February 2025.
This past winter in ERCOT was fairly low key for battery energy storage systems (BESS) – and February 2025 was no exception. The month showed low Real-Time volatility, with just one instance of prices crossing the $1K mark with Day-Ahead (DA) energy prices on 2/20.
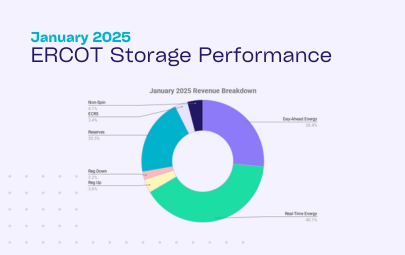
In this pricing environment, we see top performing assets leverage DA energy and Ancillary Services (AS) to maximize revenue. In fact, 63% of all revenue generated in ERCOT in January was from DA energy and AS.
Performance Overview
February 2025 delivered relatively modest returns for energy storage assets in ERCOT, consistent with the overall low-volatility winter trend.
Across the fleet, we saw:
- Highest earning asset made $5.71/kW, while the top 20 performers averaged $4.40/kW
- Median asset brought in $1.75/kW, with the fleet average slightly higher at $1.95/kW
- 21% of total revenue came from DA energy, but among the top revenue-generating assets, that share rose to 30%
From a performance (measured by percent of DA TB2 captured) standpoint:
- Top asset captured 112% of its DA TB2 opportunity, and the top 20 averaged 85%
- Median asset captured just 44%, with the fleet average coming in at 46%
These numbers are far better indicators of how well the asset operated as it corrects for nodal volatility which, as we all know, can be a primary reason for differentiated revenue outcomes having little to do with operating strategy.
Operating Strategy Evolution: Leveraging Day-Ahead Energy
DA energy played a meaningful role in the revenue stack, continuing a trend that emerged in January. In fact, in February we saw two of the top 10 revenue generators earn the majority of their revenue from DA energy. Furthermore, the month’s top performer made ~185% of revenue from DA energy.
Strategically leveraging DA energy can lead to both performance and revenue uplift – especially in these months with less RT volatility. In February, DA energy cleared higher than RT energy in 63% of hours, and 72% of morning peak (6-8am) hours.
Of course, this strategy isn’t without risk. Committing to DA energy comes with deliverability risk, and it limits RT flexibility. Operators must be confident in both their forecasts and operational readiness to execute reliably.
Day-Ahead Operating Strategy Comparison
To better understand how operators are approaching DA energy, we took a look at the bidding and dispatch profiles of two high performing assets in the Houston Load Zone. Both showed DA energy as a significant portion of their revenue stack.
At a high level, one used DA energy to collect incremental revenue each day – hit a bunch of singles. The other bet more on DA energy, aiming for a bigger payout – struck out a few times until it hit a home run.
Over the course of the month, Asset #1 had slightly higher revenue outcomes, coming in at $1.97/kW compared to Asset #2 with $1.96/kW.
From an operating strategy standpoint, we can see that Asset #1 does a better job with bid allocation on the majority of days – except for February 20th where Asset #2 hit the price spike effectively.
On 2/20, Asset #2 allocated to DA energy during the peak morning hours – from 7-9am – when DA prices cleared over $800 at its node. The asset also effectively discharged into the spike, covering its DA energy position. This resulted in $0.84/kW on the operating day.
February 20th Operating Strategies:
In contrast, Asset #1 had awards in AS products (ECRS, Reg Up, and Non-Spin) during the morning peak. These products still provided above average returns, with prices in the $220-$270 range. However, missing the highest priced product left the asset with $0.51/kW on the day.
Interesting day deep dives
February 20, 2025
This month, the highest revenue day for the majority of assets was February 20th. We go into details on why this is the case in this case study – but in summary the market was grappling with:
- Extreme cold
- High forecasted demand (80GW+)
- Low renewable generation participation
This caused Day-Ahead (DA) energy prices to clear close to $1k (node dependent) in both the 7am and 8am hours.
What might a successful operating strategy have looked like?
Let’s take a look at the North Load Zone. One of the zone’s top performing assets was awarded DA energy and some AS (ECRS and Non-Spin) during the morning ramp. Similar to what we saw above, DA energy drove the majority of revenue in this period, AS prices also cleared relatively high ~$220-270, which added some incremental earnings.
We can also see that this asset charged in the early morning so they could deliver on their obligation. Since DA energy pricing at this node was higher ~$1,000, the asset ended the day at $1.29/kW.
In contrast, a median performing asset in the North Load Zone, did not get awarded DA energy and rather focused on Reserves and Non-Spin. The asset discharged a bit around the peak – but missing the highest priced product resulted in revenue around $0.62/kW on the day.
Looking across the top revenue-generating and top-performing assets by zone on February 20th, a few things stand out.
- Assets in ERCOT’s West Load Zone benefited from higher prices overall — meaning even BESS with less aggressive DA commitments could still outperform peers in other zones.
- Higher performers (% DA TB2 captures) from the month generally did better on this day. Intuitively, this makes sense given high performers tend to be more strategic in identifying the highest priced products at the right times rather than relying on Real-Time (RT) price volatility to drive returns.
-
ERCOT Storage Performance
January 2025 Performance | ERCOT
04/28/25
-
ERCOT Storage Performance
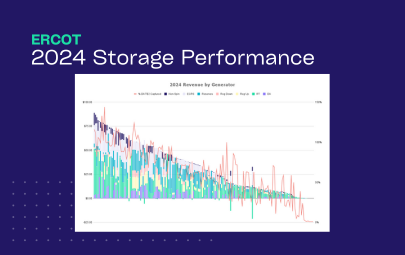
2024 Storage Performance | ERCOT
04/09/25
-

ERCOT Storage Performance
December 2024 Performance | ERCOT
03/17/25
-

ERCOT Storage Performance
November 2024 Performance | ERCOT
02/24/25
-

Guides
Benchmarking Energy Storage Performance in ERCOT: What Good Looks Like
02/24/25