ERCOT Storage Performance
ERCOT Storage Performance | February 2026
Looking back at storage asset operations and performance outcomes from February 2026.
February was the leanest revenue month for ERCOT energy storage since RTC+B launched. Daily revenue never broke $0.10/kW, and the premium that drove January’s revenue moved firmly out of Day-Ahead Energy and into Real-Time. Doing well in February meant being agile enough to capture RT spikes as they surfaced.
Revenue overview
Where January was a Day-Ahead (DA) Energy month driven by Winter Storm Fern, February’s opportunity moved into Real-Time (RT) Energy. Fleet-average DA TBx came in at $1.70/kW while RT TBx ran higher at $2.56/kW, making February the lowest total opportunity month since RTC+B launched.
TBx is the daily spread between a battery’s highest and lowest priced intervals, where x represents the battery’s duration – the ceiling for perfect arbitrage.
With a higher RT TBx, the available spread was concentrated in RT Energy, and this is shown with almost all of top earners’ revenue from RT Energy.
- Highest earning asset made $2.88/kW, while the top 50 revenue generators averaged $1.86/kW
- Median asset brought in $0.90/kW, with the fleet average higher at $0.99/kW
- RT energy made up the majority of revenue at 80%
Performance overview
The average asset captured 61% of DA TBx in February, the highest rate since RTC+B launched.
DA TBx capture measures how much of the DA TBx an asset captures, calculated as total revenue divided by DA TBx.
Over a third of the opportunity was still left on the table, but the fleet’s RT Energy reads were strong enough to deliver a record conversion rate even in a thin month.
Similar to the top earners, the top performers also pulled the majority of their revenue from RT Energy, but they layered Ancillary Services (AS) on top of it. That broader stack converted more of the available opportunity into revenue.
- Top performing asset captured 137% of its DA TBx opportunity, and the top 50 averaged 94%.
- Median and average asset captured 61%.
Revenue mix
RT Energy dominated the revenue mix in February. Even the top performers, with the lightest RT Energy share of any group, still pulled 75% of their revenue from it. That tracked the price signal — RT Energy held the premium across the majority of February’s hours, including peak hours.
Real-Time Ancillary Services (RT AS) also stepped up. After months of DA AS dominating the stack, RT AS now sits at roughly an even split with DA AS across operating strategies.
What ties this all together is agility. The premium moved from DA Energy in January to RT Energy in February, with RT AS rising alongside Energy to make February a thoroughly Real-Time Market (RTM) month. The operators capturing the most opportunity are the ones who can follow value across products. February’s answer was Real-Time. Next month’s may not be.

Performance by duration
The pattern holds across duration. RT Energy makes up the majority of revenue at every duration band, and the share grows as duration grows.
Breakdown by asset duration:
- Short duration assets (≤1.24 hours) earned a larger share of their revenue from AS (and the smallest share from RT Energy) than other duration bands. AS stack is the smart use of their limited energy discharge capacity.
- Mid-duration assets (1.25–1.74 hours) have slightly more discharge to play multiple RT spreads. Top 10 leaned into that, pushing harder into RT Energy than the average and pulling back from AS.
- Long duration assets (>1.75 hours) unlock the option to play multiple revenue streams at once. The top 10 used that optionality, picking up incremental DA Energy and holding more AS than the mid top 10 to run a balanced stack on top of their RT base.
Daily revenue snapshot
Across February, daily revenue never broke $0.10/kW, clear proof that this was a lean month. The defining skill in February was agility – the ability to follow value as it moved across products, across hours, and across markets. The operators who captured the most pivoted into RT Energy when the spread sat there, layered AS where it made sense, and matched their playbook to their asset’s duration.
*Top earners defined as highest $/kW
**Top performers defined as highest percent of DA TBx captured
-

ERCOT Storage Performance
January 2026 Performance | ERCOT
04/16/26
-
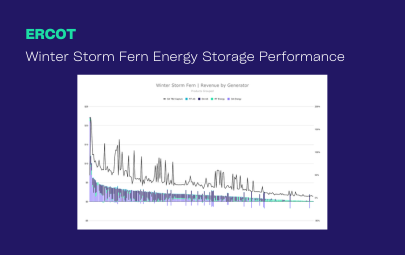
ERCOT Storage Performance
Winter Storm Fern Performance | ERCOT
04/16/26
-
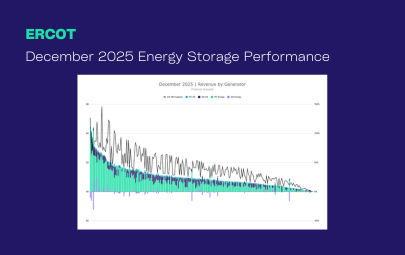
ERCOT Storage Performance
December 2025 Performance | ERCOT
03/20/26
-
Case Studies
Capturing ERCOT’s first post-RTC+B price spike
12/22/25
-
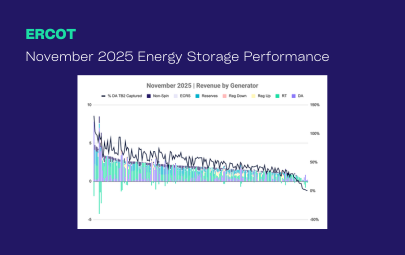
ERCOT Storage Performance
November 2025 Performance | ERCOT
02/18/26
-
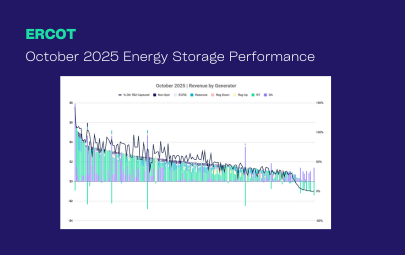
ERCOT Storage Performance
October 2025 Performance | ERCOT
01/14/26
-
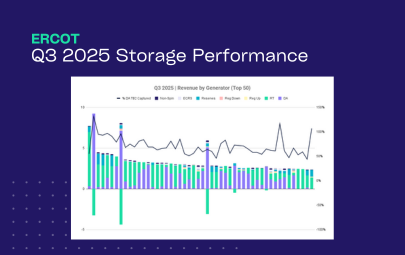
ERCOT Storage Performance
Q3 2025 Performance | ERCOT
12/16/25
-
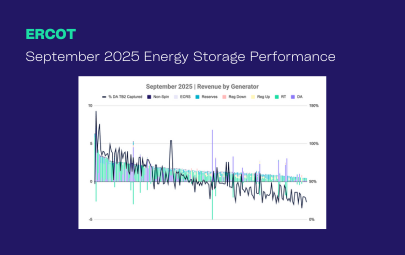
ERCOT Storage Performance
September 2025 Performance | ERCOT
12/15/25
-
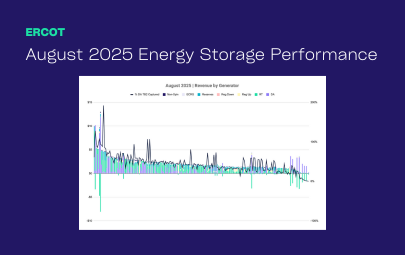
ERCOT Storage Performance
August 2025 Performance | ERCOT
11/19/25
-
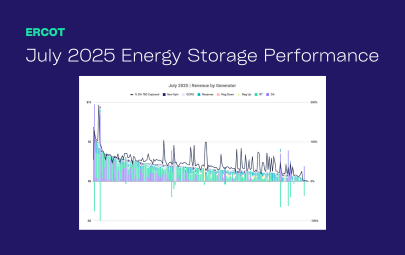
ERCOT Storage Performance
July 2025 Performance | ERCOT
10/15/25
-
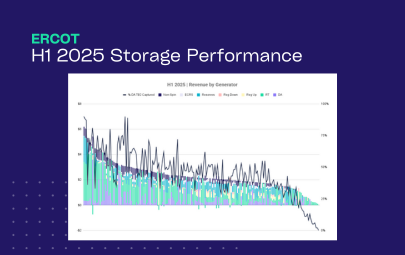
ERCOT Storage Performance
H1 2025 Performance | ERCOT
09/16/25
-
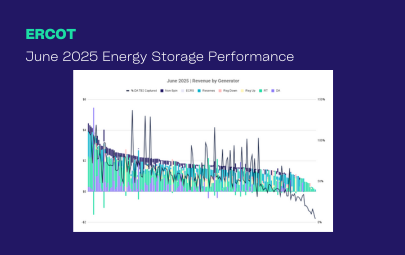
ERCOT Storage Performance
June 2025 Performance | ERCOT
09/16/25
-
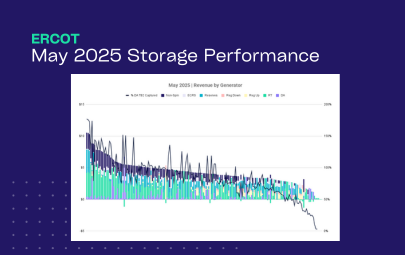
ERCOT Storage Performance
May 2025 Performance | ERCOT
08/12/25
-
ERCOT Storage Performance
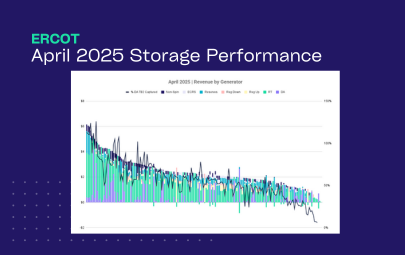
April 2025 Performance | ERCOT
07/15/25
-
ERCOT Storage Performance
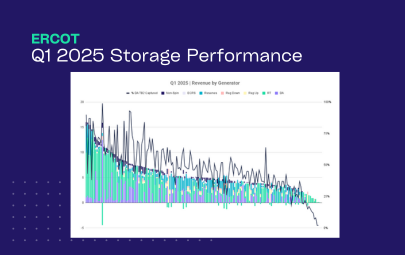
Q1 2025 Performance | ERCOT
06/26/25
-
ERCOT Storage Performance
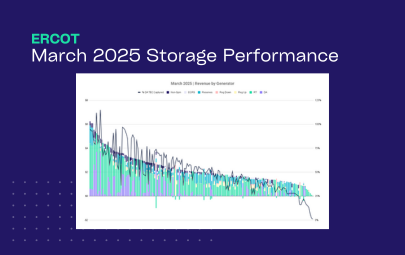
March 2025 Performance | ERCOT
06/17/25
-
ERCOT Storage Performance
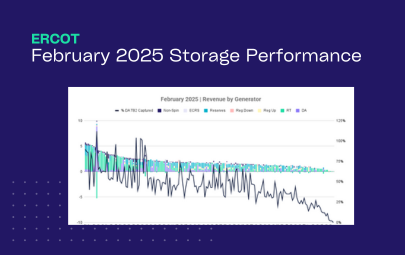
February 2025 Performance | ERCOT
05/13/25
-
ERCOT Storage Performance
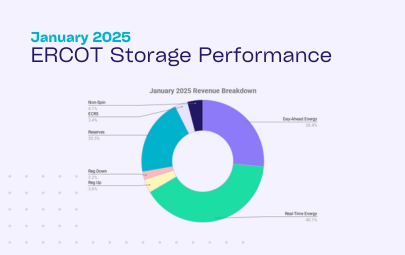
January 2025 Performance | ERCOT
04/28/25
-
ERCOT Storage Performance
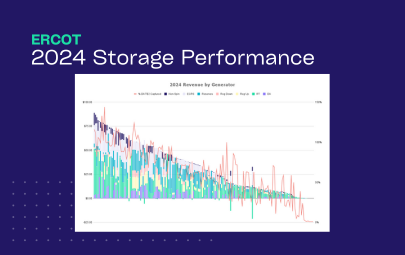
2024 Storage Performance | ERCOT
04/09/25
-

Guides
Benchmarking Energy Storage Performance in ERCOT: What Good Looks Like
02/24/25