Context
We often receive questions from storage developers, operators, and energy traders around the importance and efficacy of energy price forecasts. In particular, whether Tyba’s AI-based forecasts1 outperform a persistence forecast approach2. With this blog, we dive into how Tyba thinks about forecasting performance and walk through examples of our forecasting performance in CAISO and ERCOT benchmarked against a persistence approach.
Disclaimer: Forecasts are only a portion of an overall modeling stack needed to effectively bid energy storage assets into ISO markets. Additional model components include optimization models and bidding models. This blog isolates the forecast variable to understand how different forecast approaches impact outcomes.
How do we think about performance?
When evaluating the efficacy of a forecasting model/approach, we evaluate performance across a range of metrics including:
- Statistical accuracy (Mean Absolute Error)
- Shape accuracy (Spearman correlation)
- Task performance (Revenue capture)
Statistical Accuracy – Mean Absolute Error
Mean Absolute Error (MAE) calculates the average of the absolute differences between the actual values (or prices) and the predicted values (or forecasted prices). It provides a measure of the model’s predictive accuracy. A smaller MAE indicates a more accurate model, as it means that the predicted values are, on average, closer to the actual values.
Shape Accuracy – Spearman correlation
Spearman correlation is a measure of the strength and direction of association between the ranks of two time series variables. In the case of price forecasting, we compare the forecasted vs. actual prices series for a given day.
For example, for the Day-Ahead Energy product, we would rank each operating hour in a given day from highest price to lowest price for the Tyba forecast and the actual prices. If the Tyba order perfectly matched the actual order, that would translate to a Spearman correlation of 1 for that day. If the Tyba order and actual order were perfectly inverse, the Spearman correlation would be -1 for the day.
Across a long evaluation horizon, the daily average Spearman correlation is a helpful indicator of the shape accuracy of your forecasts. For storage, having an accurate view of the shape of prices for the day helps you to set an operating/bidding strategy to sell (discharge) when prices are highest and buy (charge) when prices are lowest.
Task Performance – Revenue Capture
Ultimately, storage operators care about how price forecasts translate to revenue outcomes. We view this as the ultimate “task” that the forecasts + downstream optimization & bidding models are trying to achieve.
Evaluating revenue capture requires using optimization and bidding models, so we hold assumptions for those models constant to isolate for the effects of price forecast quality. Likewise, to benchmark performance, we compare the forecast approaches (Tyba and persistence) vs. a perfect case which assumes full knowledge of actual prices when setting your operating plan. While the perfect case is unrealistic, it sets the high water mark from a revenue outcome perspective.
Performance Deep Dive: Tyba vs. Persistence in CAISO and ERCOT
We compared Tyba’s forecasts vs. a persistence-based forecasting approach for the Day-Ahead (DA) and Real-Time (RT) energy prices at ERCOT’s North Hub and CAISO’s SP15 Hub.
Price vintages
For DA Energy, Tyba generates a forecast for each hour of the next operating day prior to the close of the DA Market (so typically between 6-9am).
For RT Energy, Tyba generates an initial forecast for each hour of the next operating day prior to the close of the DA Market. We then re-forecast RT energy prices once DA prices have been posted and on a rolling basis prior to close of each operating hour.
Other assumptions
For the MAE and Spearman correlation metrics, the case case study compares the following:
- DA Energy – Tyba’s pre-DA bid close vintage vs. a trailing day persistence.
- RT Energy – Tyba’s post-DA bid close vintage vs. a trailing day persistence.
For the revenue capture analysis, we look at a bidding strategy that co-optimizes across the DA and RT Energy markets (or DART approach), with the following constraints:
- 1 cycle per day
- 85% RTE
- 2 hour duration for the North Hub project
- 4 hour duration for the SP15 project
- No virtual positions
MAE (in $/MWh)
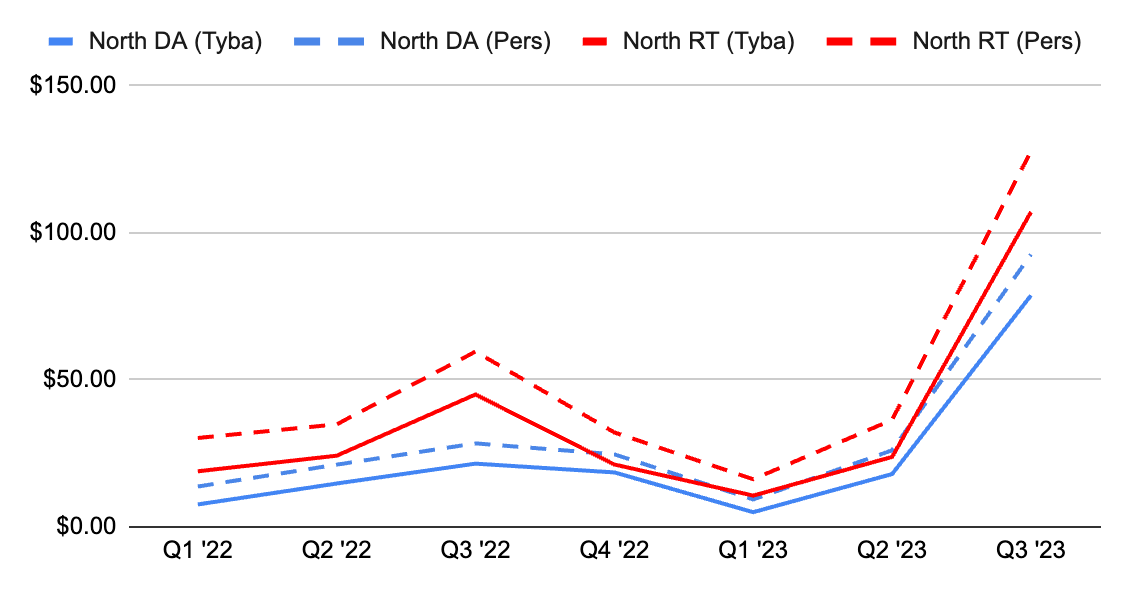
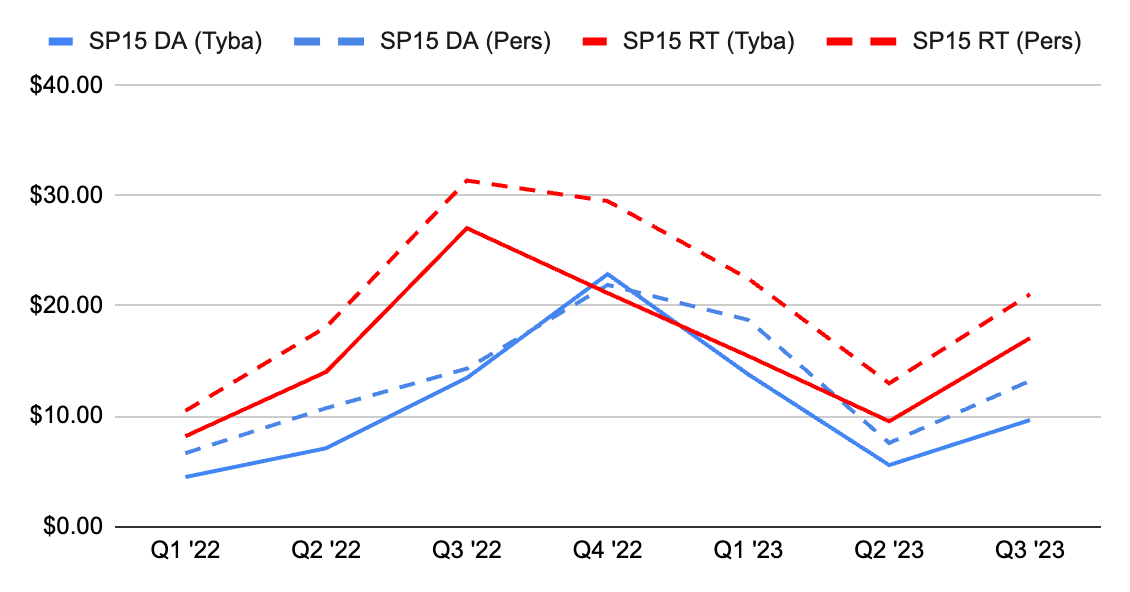
- Tyba consistently outperforms the persistence approach.
- In both CAISO and ERCOT, DA energy prices are more predictable (e.g. lower MAE) than RT energy prices.
Spearman correlation
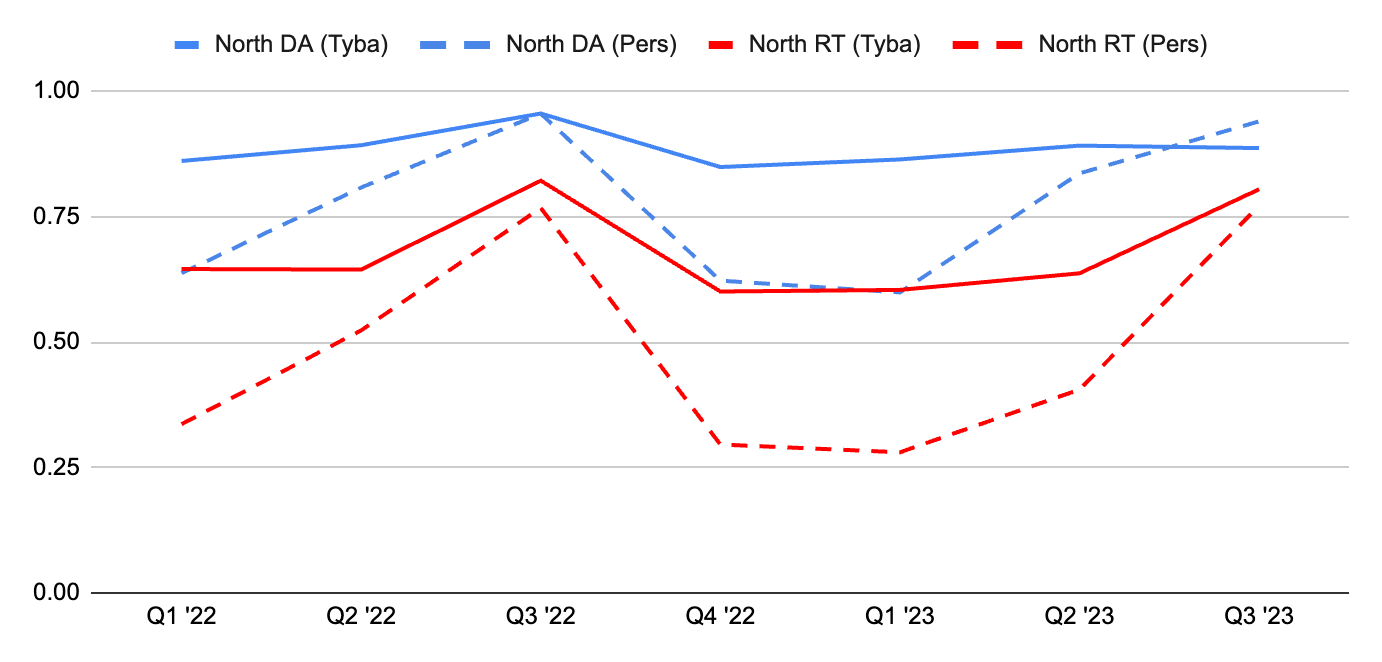
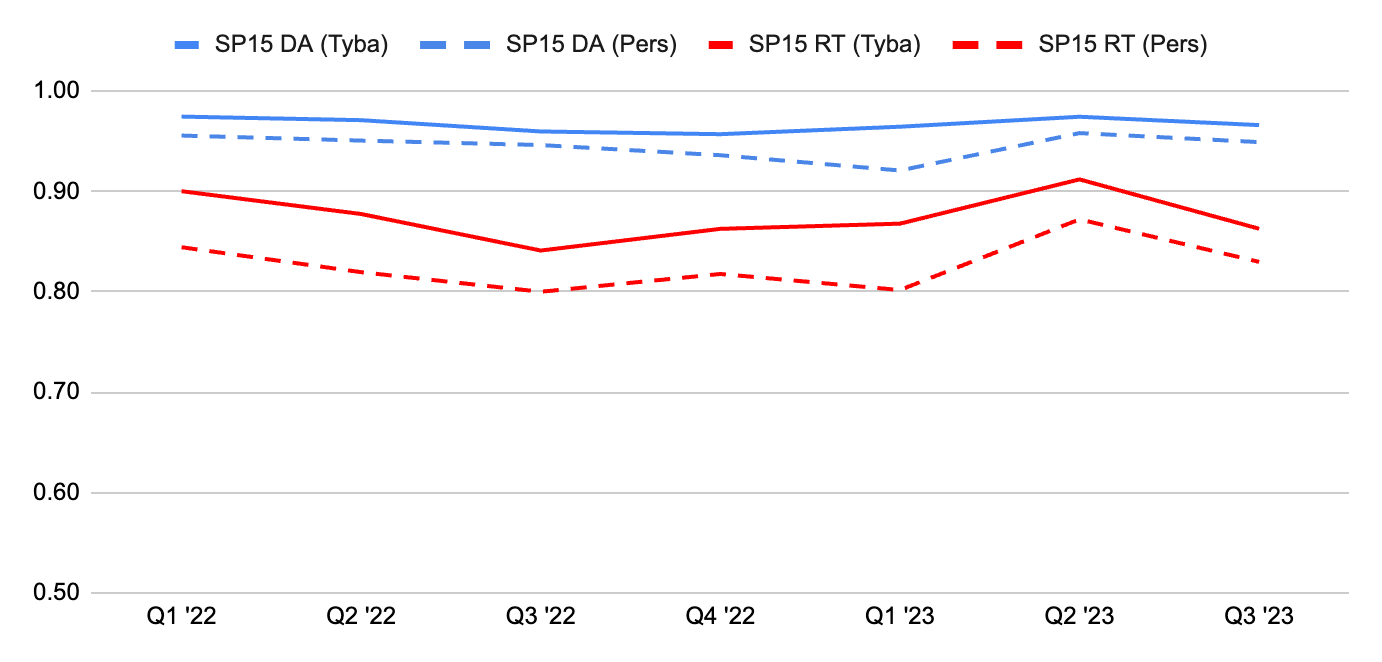
- Tyba consistently outperforms the persistence approach. The lone exception is Q3 ‘23 for the North DA, where persistence and Tyba converge at very high Spearman correlation levels (0.90+).
- In both CAISO and ERCOT, the shape of DA energy prices are more consistently shaped (e.g. higher Spearman Correlation) than RT energy prices
Revenue Capture
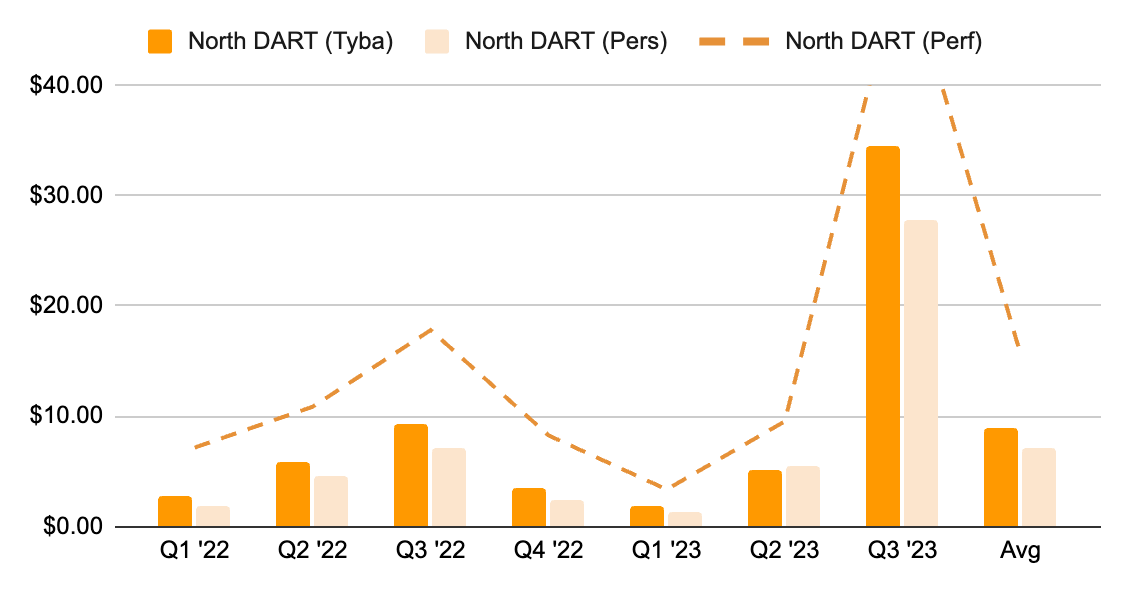
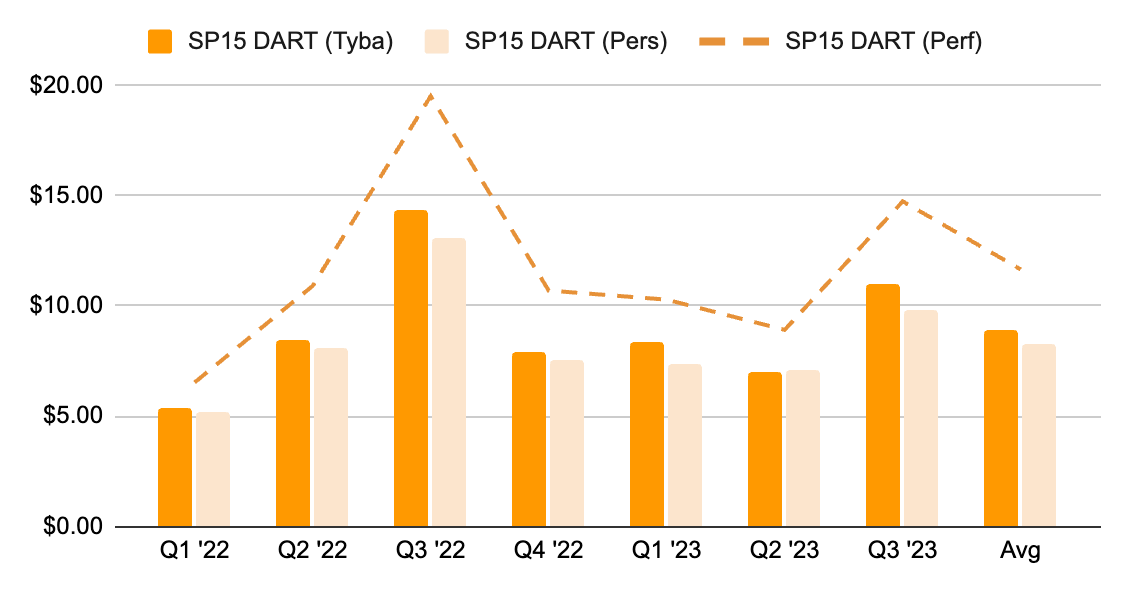
- Tyba consistently outperforms the persistence approach. Despite having a slightly lower Spearman correlation in Q3 ‘23 for the North Hub DA, Tyba outperforms persistence by 24% from a task perspective during that same period. This is tied to stronger performance by Tyba during high revenue days as well as ability to more accurately choose between the DA and RT markets.
- For North Hub, the 25% boost over persistence for a 100MW storage asset translates to ~$2.2M incremental annual revenue.
- For SP15, the 8% boost over persistence for a 100MW storage asset translates to ~$750k incremental annual revenue.
- Performance boost over persistence is higher for the North Hub. CAISO nodes typically have a more consistent price shape than ERCOT, which tracks with persistence forecast Spearman correlation being significantly higher for the SP15 vs. North Hub.
Takeaways
- It is beneficial to evaluate price forecast efficacy across a range of metrics (MAE, Spearman, revenue capture).
- Tyba’s AI-based forecasting approach outperforms a persistence forecasting approach across nearly all metrics and measurement periods. If using a persistence-based forecasting approach, you are likely leaving $ on the table.
Other Applications
While this analysis focused on applying forecasts to energy storage bidding, this can be extended to other applications including:
- Storage underwriting, including defending merchant revenue capture by demonstrating predictability/forecastability of prices for your node/project.
- Convergence bidding, hedging, and other non-storage related applications.
Footnotes:
- Tyba leverages neural network-based models to develop short term price forecasts for hub/nodal energy prices and ancillary service prices across various ISOs.
- A persistence forecast assumes the current conditions will persist and that future conditions will be the same as the present. For energy market applications, a common persistence forecast approach is assuming that tomorrow’s prices will be the same as today’s.