ERCOT Storage Performance
ERCOT Storage Performance | October 2025
Looking back at storage asset operations and performance outcomes from October 2025.
October was shoulder season month, and it showed. The month had low price volatility, so no single strategy led to top performance. In fact, the ERCOT fleet saw success with a variety of operating strategies – though, in this pre-RTC+B world energy products accounted for the majority of revenue – especially for top performers.
Revenue outcomes
Revenue rose in October, but performance (measured by DA TB2 capture) stayed essentially flat compared to September, suggesting the fleet didn’t fully convert the slightly better opportunity. The top six revenue generators captured over 100% DA TB2, yet their playbooks varied. Some prioritized Day-Ahead (DA) energy (even absorbing Real-Time (RT) energy losses to support the strategy), while others leaned in on RT energy, only lightly layering in DA energy and Ancillary Services (AS).
With low price volatility, it’s not surprising that there wasn’t one defining spike or strategy that won outright. Instead, the month rewarded operators with steady execution, able to consistently pick up the smaller opportunities that arise.
- Highest earning asset made $7.00/kW, while the top 50 revenue generators averaged $3.48/kW
- Median asset brought in $1.93/kW, with the fleet average slightly higher at $2.05/kW
- Energy made up 74% of revenue with RT energy making up the majority of revenue at 45%
Similar to the revenue composition in September, energy still made up the bulk of fleet revenue – but DA energy’s share fell by 17%, with Reserves and Non-Spin picking up most of that gap. Interestingly, the majority of the fleet’s revenue came from RT energy (45%), despite DA energy clearing higher than RT energy during 61% of peak hours. That points to the DA premium either being misforecasted or simply too thin to justify the opportunity cost of committing in the day-ahead.
At the top of the leaderboard, revenue stacks were fairly consistent – both top earners and performers earned ~85% of revenue from energy – while the broader fleet relied more on AS.
Asset performance
Similar to the top revenue generators, the top performers took a range of strategies rather than a single approach. Top results largely came down to making money where the market offered it, relying on accurate forecasts and creative bidding to pick up revenue wherever possible.
That execution shows up in the spread across the fleet, where the top 50 assets captured over 70% of their DA TB2 while the bottom 50 captured below 37%. In other words, performance was widely distributed, and the gap between top and bottom performing assets highlights the real upside available from more strategic day-to-day operations.
- Top performing asset captured 143% of its DA TB2 opportunity, and the top 50 averaged 87%
- Both the median asset and the fleet average captured 53%
- Energy accounted for 85% of the revenue of the top 20 performers.
Asset performance by duration
We typically see assets of differing durations take different operating approaches, but in October every duration cohort made the majority of revenue in energy. We do begin to see some variation, though, when we zoom in on the top 10 performers for each duration bucket. The longer the duration, the higher the percentage of revenue coming from DA energy and lower from DA AS.
Breakdown by asset duration:
- Short duration assets (<1.1 hours) continued to lean away from DA energy. Their revenue composition points to more aggressive AS participation, which can be a lower-risk strategy compared to committing to a DA energy obligation that necessitates delivery to avoid imbalance costs. Plus, there’s an added opportunity to capture higher RT energy prices if awards clear. This approach also helps assets maintain the flexibility to discharge in real time if prices are compelling.
- Mid-duration assets (1.1–1.6 hours) leaned more on RT energy, whereas the top 10 showed a more balanced mix across DA and RT energy and AS. That balance is another nod to how October played out – one product did not consistently dominate, so bidding across was a winning approach.
- Long duration assets (>1.6 hours) on the whole also made the majority of revenue in RT energy. However, the top performers strategically bet on DA energy, which, as we now know, had a premium during peak hours 61% of the time. There is also less opportunity cost for longer duration assets to bid into DA energy given the additional energy they can store.

Interesting day deep dive
When you look at revenue by day, October 21st delivered the strongest earning opportunity for the storage fleet.
October 21, 2025
October 21st stood out with both DA and RT price spikes hitting in the evening – and peaking at $222/MWh. DA energy cleared higher than RT energy at 6pm, but that relationship flipped later in the peak window, and RT energy overtook DA energy from 7-9pm.
How did a high performing asset operate on October 21st?
The top asset in the West Load Zone took a smart hedging approach through the evening peak. From 6-8pm, the operator cleared a portion of capacity into DA energy, locking in high prices of $222/MWh from 6-7pm and $168/MWh from 7-8pm.
When the operating intervals came around and RT energy prices were also high (~$211/MWh), they met their DA energy obligations and layered on RT energy to capture the incremental revenue. When 8pm rolled around and RT energy prices were still high, the asset discharged the remainder of their capacity into RT energy, capturing the ~$200/MWh RT energy prices. That combination translated to about $0.48/kW for the day.
*Top earners defined as highest $/kW
**Top performers defined as highest percent of DA TB2 captured
-
ERCOT Storage Performance
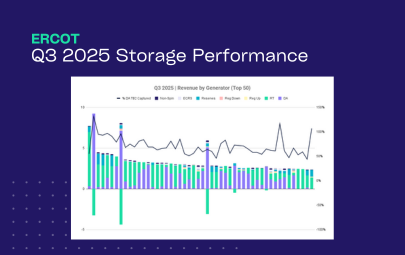
Q3 2025 Performance | ERCOT
12/16/25
-
ERCOT Storage Performance
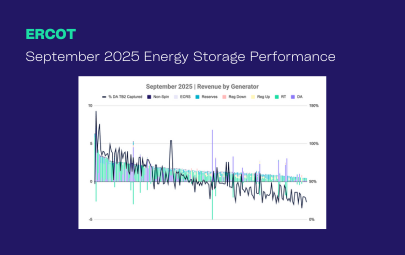
September 2025 Performance | ERCOT
12/15/25
-
ERCOT Storage Performance
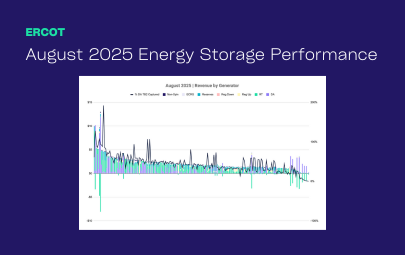
August 2025 Performance | ERCOT
11/19/25
-
ERCOT Storage Performance
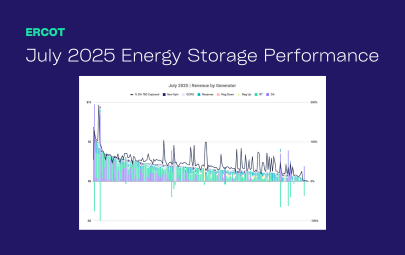
July 2025 Performance | ERCOT
10/15/25
-
ERCOT Storage Performance
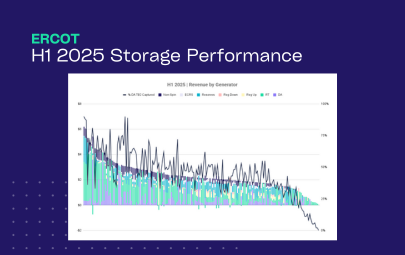
H1 2025 Performance | ERCOT
09/16/25
-
ERCOT Storage Performance
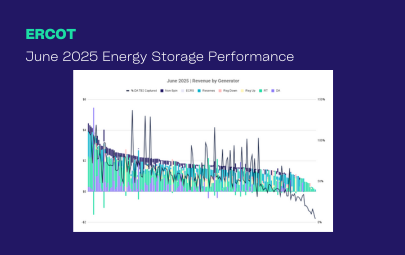
June 2025 Performance | ERCOT
09/16/25
-
ERCOT Storage Performance
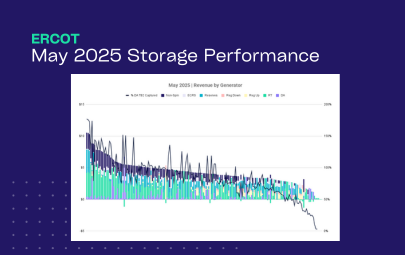
May 2025 Performance | ERCOT
08/12/25
-
ERCOT Storage Performance
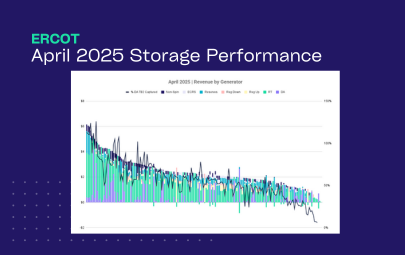
April 2025 Performance | ERCOT
07/15/25
-
ERCOT Storage Performance
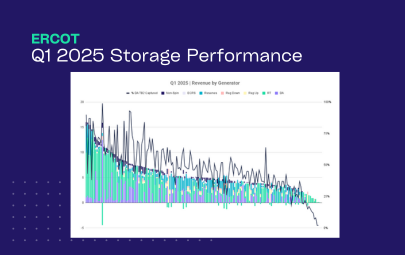
Q1 2025 Performance | ERCOT
06/26/25
-
ERCOT Storage Performance
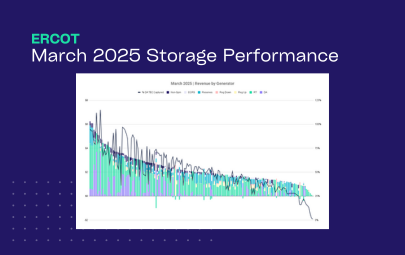
March 2025 Performance | ERCOT
06/17/25
-
ERCOT Storage Performance
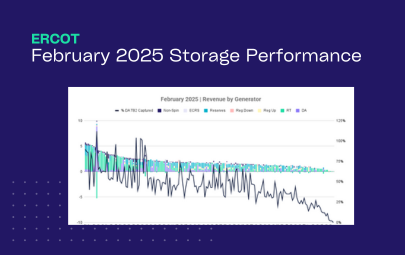
February 2025 Performance | ERCOT
05/13/25
-
ERCOT Storage Performance
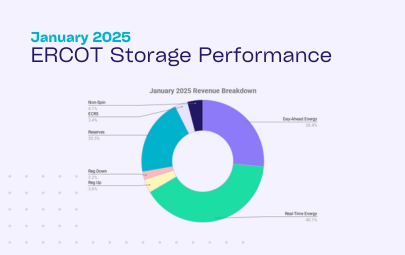
January 2025 Performance | ERCOT
04/28/25
-
ERCOT Storage Performance
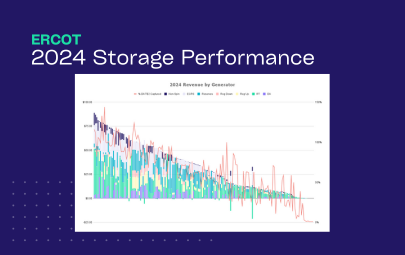
2024 Storage Performance | ERCOT
04/09/25
-

Guides
Benchmarking Energy Storage Performance in ERCOT: What Good Looks Like
02/24/25