ERCOT Storage Performance
ERCOT Storage Performance | December 2025
Looking back at storage asset operations and performance outcomes from December 2025.
December marked the first month under RTC+B, and the market didn’t wait for anyone to catch up – average fleet revenue was the lowest of 2025. RTC+B changed the optimization problem entirely, requiring operators to create a new playbook. There was no clear strategy to borrow from, and this month’s divergence across the fleet reflects that.
Revenue outcomes
Average revenue was down 49% from November, but that number understates what was available. December had real opportunities in both Day-Ahead (DA) and Real-Time (RT) energy. DA energy carried the premium for the majority of hours, and when RT energy prices ran, they were large enough to flip the math entirely.
Capturing that revenue required knowing which hours each product would win and being positioned ahead of time.
- Highest earning asset made $4.08/kW, while the top 50 revenue generators averaged $2.12/kW
- Median asset brought in $0.88/kW, with the fleet average higher at $1.02/kW
- RT energy made up the majority of revenue at 72%
Asset performance
The top asset in December captured 146% of its DA TB2 against a fleet median of 38%. That’s a 4x gap, highlighting a significant performance divergence. Although DA energy had the premium during most peak hours, on average RT TB2 had a 44% uplift compared to DA TB2. The top performers (measured by DA TB2 capture) leaning into RT energy weren’t making a blind bet – the nodal volatility backed it up.
The best operators in December didn’t share a single strategy. They shared the discipline to match their dispatch to their node, and the volatile nodes with strong RT price exposure rewarded operators who recognized it and leaned in.
- Top performing asset captured 146% of its DA TB2 opportunity, and the top 50 averaged 81%.
- Median asset captured 38%, with the fleet average slightly higher at 42%.
Performance divergence
4x performance gap between the top performer and median – what happened?
Operators faced mixed price signals, making positioning difficult. Across the majority of December, DA carried the premium over RT in every product. For energy, DA came in higher than RT in 60% of hours, with AS products running even higher:
- Reg Up 97%,
- Reg Down 79%,
- Reserves 97%,
- ECRS 95%,
- and Non-Spin 95%
By that measure, DA was the clear premium product. However, the 44% RT TB2 uplift over DA TB2 tells the other half of the story. The hours where RT won weren’t marginal wins, they were significant. The fleet was navigating a month where DA energy was right more often but when RT energy was the correct call, it was by a wider margin, and capturing either required proper forecasting and bidding to properly position across each market.
In terms of revenue, RT energy led revenue with DA Ancillary Services (AS) layered in. DA energy participation was thin – only 50% of the fleet participated with asset backed DA positions (or TPOs). Though, the lack of DA energy representation in the Revenue Breakdown Charts isn’t completely due to a low participation, the DA energy losses mean operators either:
- Discharged into DA energy when RT energy prices were higher
- Charged into DA energy
The top performers and earners got to the top by staying active in both energy markets. The rest of the fleet leaned on RT energy but were not always positioned to capture it when the prices actually moved.
December’s performance divergence reflects that this market is still being figured out. Post-RTC+B, the operators capturing the most upside are the ones willing to take on DA risk deliberately. Full RT participation is the safer path but it caps upside. The operators at the top of December’s results made the DA commitment and had the tools to back it up in RT when it mattered.
Asset performance by duration
Similar story, across different duration assets the fleet leaned into RT energy. Though, the top 10 in each bucket leaned less so, pulling more revenue from other products.
Breakdown by asset duration:
- Short duration assets (≤1.0 hours) stuck to their typical playbook, leaning on RT energy supplemented with DA AS. The top 10 pushed further into AS than the rest.
- Mid-duration assets (1.1–1.6 hours) followed a similar pattern with RT energy leading, though the top 10 shifted more toward DA energy, which tracks given how consistently the DA premium held.
- Long duration assets (>1.6 hours) mirrored mid-duration across the fleet, but the top 10 took the DA energy shift further, carrying a higher concentration.

Interesting day deep dive
December 14th marked the highest fleet revenue of the month, driven by a RT price run that most operators only partially captured.
December 14, 2025
Outside of the first two hours of the day, RT energy had the premium over DA energy. DA AS led RT AS pricing through the morning and into the afternoon, then gave way at 6pm as RT prices surged. RT energy crossed above $100/MWh at 2pm and kept climbing, reaching $535/MWh by 9pm, and by that point the DART spread was sitting above $400/MWh in favor of RT over DA energy.
How did a high-earning asset operate on December 14th?
The day before, the operator positioned into DA AS, specifically Non-Spin and Reserves, locking in the AS premium. On December 14th, the operator charged during the cheapest hours of the day, the opening two hours after midnight, keeping SOC ready for the RT spike they were anticipating.
From 4pm to 8pm, the operator discharged into RT energy, capturing the elevated prices as they climbed. The execution was strong but not perfect. The asset ran out of SOC before 9pm and missed the $535/MWh peak, leaving the most valuable hour of the day uncaptured.
*Top earners defined as highest $/kW
**Top performers defined as highest percent of DA TB2 captured
-
ERCOT Storage Performance
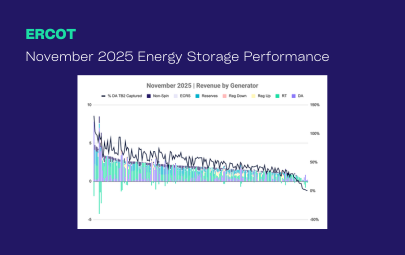
November 2025 Performance | ERCOT
02/18/26
-
ERCOT Storage Performance
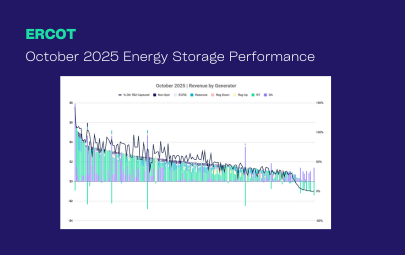
October 2025 Performance | ERCOT
01/14/26
-
ERCOT Storage Performance
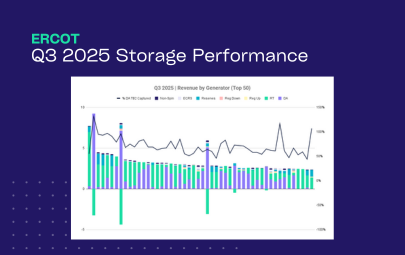
Q3 2025 Performance | ERCOT
12/16/25
-
ERCOT Storage Performance
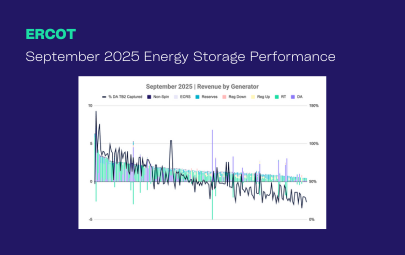
September 2025 Performance | ERCOT
12/15/25
-
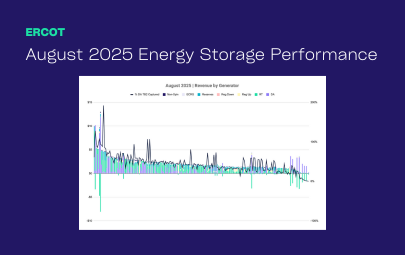
ERCOT Storage Performance
August 2025 Performance | ERCOT
11/19/25
-
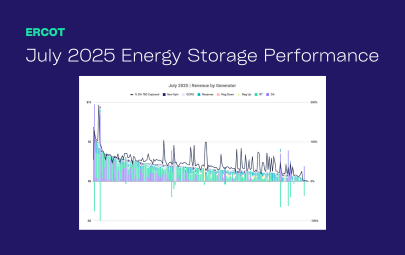
ERCOT Storage Performance
July 2025 Performance | ERCOT
10/15/25
-
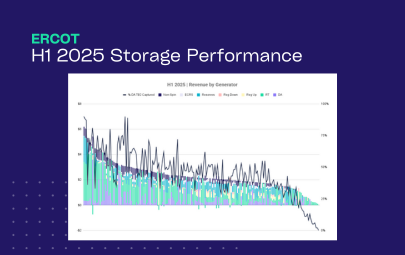
ERCOT Storage Performance
H1 2025 Performance | ERCOT
09/16/25
-
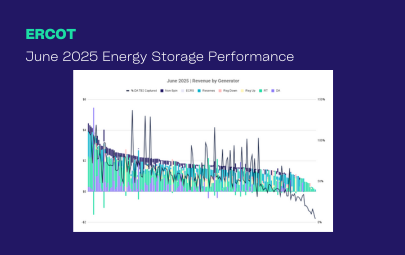
ERCOT Storage Performance
June 2025 Performance | ERCOT
09/16/25
-
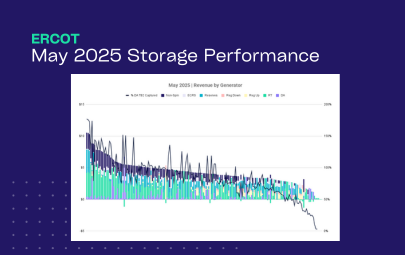
ERCOT Storage Performance
May 2025 Performance | ERCOT
08/12/25
-
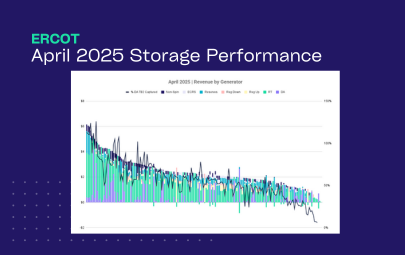
ERCOT Storage Performance
April 2025 Performance | ERCOT
07/15/25
-
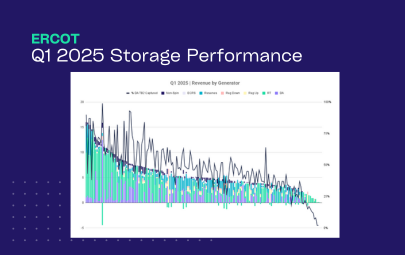
ERCOT Storage Performance
Q1 2025 Performance | ERCOT
06/26/25
-
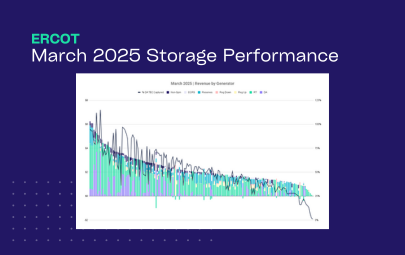
ERCOT Storage Performance
March 2025 Performance | ERCOT
06/17/25
-
ERCOT Storage Performance
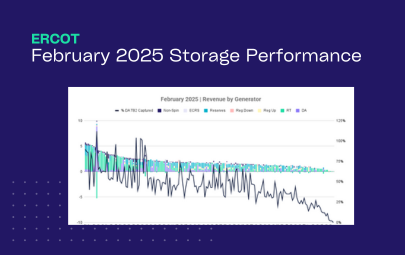
February 2025 Performance | ERCOT
05/13/25
-
ERCOT Storage Performance
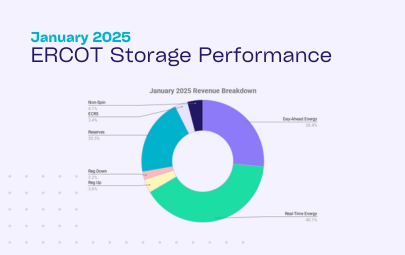
January 2025 Performance | ERCOT
04/28/25
-
ERCOT Storage Performance
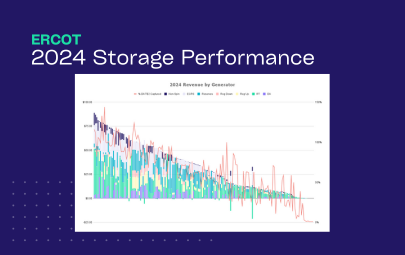
2024 Storage Performance | ERCOT
04/09/25
-

Guides
Benchmarking Energy Storage Performance in ERCOT: What Good Looks Like
02/24/25