Case Studies
Real-Time Optimization Helped Capture a $3k+ Price Spike
Accurate forecasting and real-time optimization enabled Tyba customers to captured outsized revenue during an unexpected price spike in ERCOT.
Context
An unexpected price spike in ERCOT
When an unexpected price spike on November 10, 2024 took many operators by surprise, Tyba customers were prepared.
Our day-ahead forecasts detected the potential for high Real-Time prices, so minimized commitments to Ancillary Services in the Day-Ahead Market.
As the operating day progressed, subhourly re-forcasts honed in on the exact time and magnitude of the spike – ensuring assets reserved state of charge and enabling them to discharge at full capacity into the ~$3K+ prices.

Results
Outsized revenue capture
-
$24K
Generated in a 15-minute period
(40MW BESS)
-
99%
Asset discharge
Maximized energy discharge into peak prices.
-
$3K+
Prices ~19:15
Tyba discharged into this high peak.
What happened?
Tyba’s price forecasting engine enabled a battery to capture a RT price spike through DA/RT energy and Ancillary Service co-optimization, as well as State-of-Charge management.
-
Day-Ahead
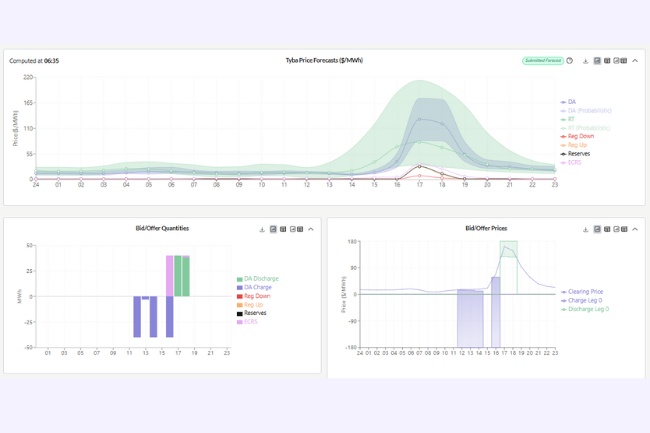
Tyba’s Day-Ahead (DA) forecasts anticipate a Real-Time (RT) price spike in the evening ramp period. Since our forecasts factor in the probability of price levels and timing, as well as the likelihood of AS deployment, we configured a DA bidding plan that gave us the flexibility to capture a RT spike.
-
Operating Day
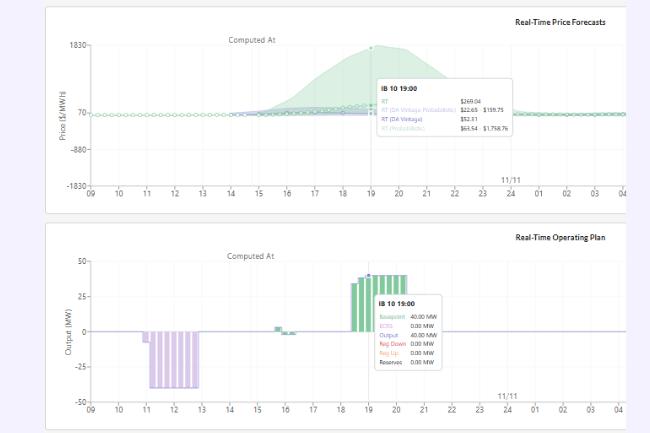
Throughout the operating day, Tyba’s rolling, sub-hourly reforcasts honed in on the time and magnitude of the spike. This affirmed that the asset ought to charge mid-day when prices were low, and store energy for discharge into the spike ~19:00.
-
Post-Spike
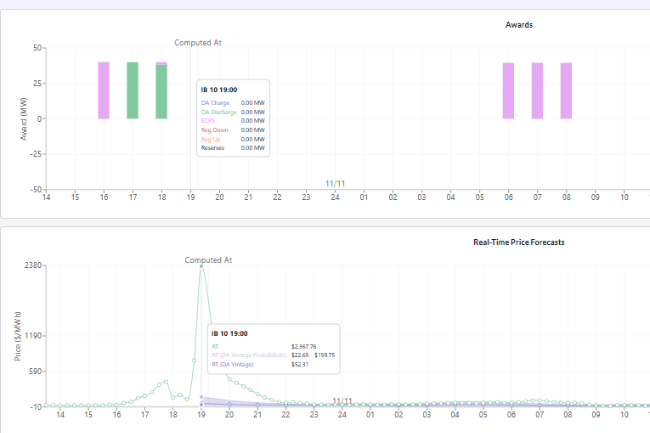
Tyba successfully captures the RT spike, discharging 100% of its power capacity into the RT spike. For a 40 MW BESS, this 15-minute interval alone resulted in ~$24K of revenue.
Forecasting Deep Dive
Tyba trains our proprietary neural network forecast model on node-specific data to capture nodal pricing dynamics, and continuously streams market data throughout the operating day. We are continuously ingesting data to feed into the neural network model, including:
- Node-specific: real-time price, weather (irradiance, wind, dew), temperature
- Zonal and grid-level: load forecasts, forecasted solar and wind generation, available generation capacity
To assess performance, we look at two key metrics:
- Price Accuracy: Mean Absolute Error (MAE)
- Shape Accuracy. Spearman Correlation to measure daily accuracy in ordering prices from highest to lowest.
We benchmark our performance across these two metrics against a naive “Persistence” approach to forecasting, in which we use the latest available day of cleared prices as the forecasted prices for the next day.
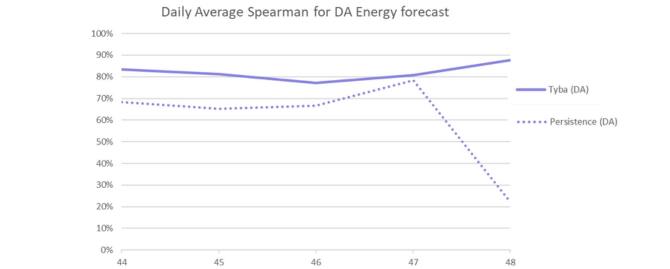
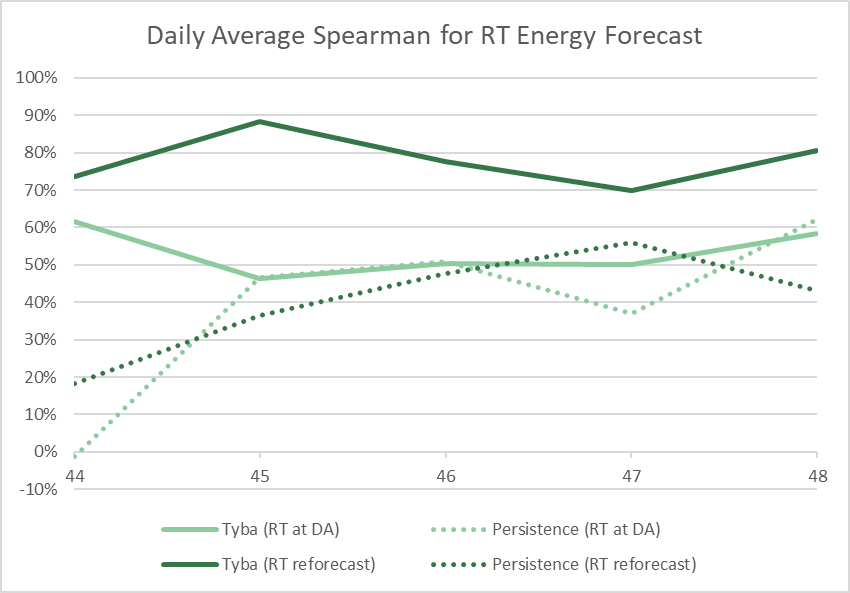
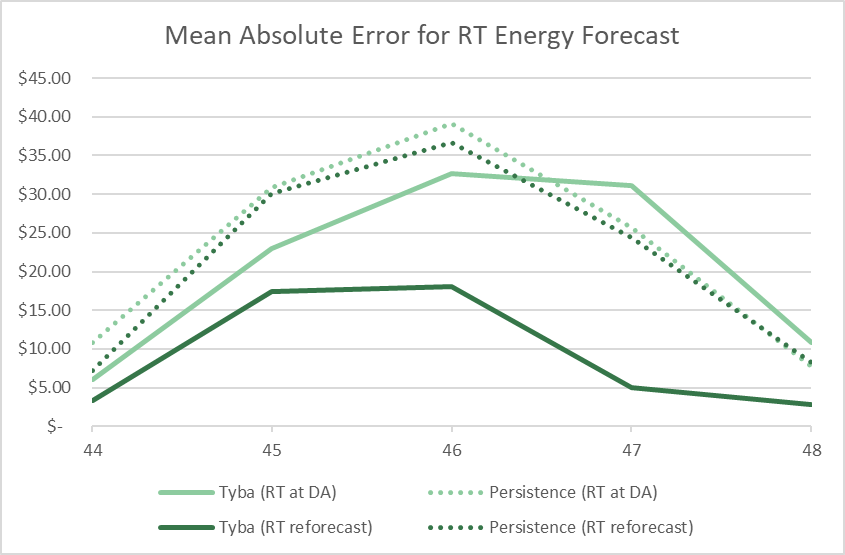
November Forecast Performance
Our November price forecast performance showcases clear:
- Uplift from Persistence benchmarks for Spearman Correlation, and significant improvement in our average spearman from RT subhourly reforecasting.
- Decrease in our MAE compared against Persistence benchmarks, and significant improvement in decreasing our MAE from RT subhourly reforecasting
In both measures, the stark improvement over Persistence benchmarks around 47-48, which accounts for the November 10th spike.
In particularly high revenue potential days, our forecasts most significantly over perform.