ERCOT Storage Performance
ERCOT Storage Performance | May 2025
Looking back at storage asset operations and performance outcomes from May 2025.
After a low key spring, ERCOT storage operators started to see the market pick up in May. Revenues rebounded, operating strategy mattered more than ever, and Ancillary Services stepped back into the spotlight for the first time this calendar year. Warmer weather, a handful of days with tight grid conditions, and lingering thermal outages combined to create new price dynamics — and new opportunities for well-positioned assets.
Revenue outcomes
May was a strong month for many ERCOT storage operators. The median revenue ($/kW) generated nearly doubled from April, as did the average revenue for the top 50 earning assets. This month, we saw real-time agility plus strategic bets on Ancillary Services (AS), specifically Non-Spin and RRS, play a major role in boosting returns.
- Highest earning asset made $10.56/kW, while the top 50 revenue generators averaged $6.46/kW
- The median asset brought in $4.18/kW, with the fleet average was slightly higher at $4.39/kW
- 58% of total revenue came from Ancillary Services, the highest share of any month in 2025 YTD
Asset performance
Fleet performance was up month-over-month, and while there was still a wide spread between top and bottom performers, the distribution of TB2 capture was quite normal, with the majority of assets clustered around the median.
- Top asset captured 177% of its DA TB2 opportunity, and the top 50 averaged 123%
- Median asset captured 85%, with the fleet average coming in similarly at 86%
- This month, we also saw more top revenue generators exceed their DA TB2. In fact, the top 20 earners averaged a 136% capture rate.
These benchmarks help normalize for nodal volatility and shine a light on what really matters: how well did your asset convert the available opportunity into real revenue?
Looking at the TB2 capture distributions, we see a fairly normal curve centered around the median. In fact:
- Around half the fleet captured between 50% and 70% of their RT TB2, indicating tight clustering around the median of 62%
- About 42% of assets captured captured between 60% and 90% of their DA TB2, also centered around the median of 85%
The distribution reflects more consistent execution across many operators, with fewer outliers than in previous months.
Shifting revenue composition
May marked a major shift in where storage revenue came from. AS made up the majority of earnings for the first time this year, while both DA and RT energy made up smaller shares than in previous months.
- AS accounted for 58% of total revenue — the highest share in 2025 YTD (compared to 35% on average in Q1)
- Day-Ahead energy dropped to just 9% of total revenue, down from 16% in April
- Real-Time energy made up 33%, down from 50% in April and 43% in Q1
This uptick in AS revenue was largely driven by Non-Spin and RRS, which cleared at a premium throughout the month. Non-spin, for example, had an average clearing price of $0.91/kW in May, compared to just $0.17/kW in April – that is a 5.3x increase.
Now, May was a shoulder season month — but a warmer-than-usual one — and many thermal plants that typically bid into Non-Spin were still on outage. Since thermal plants tend to bid into Non-Spin, this may have tightened supply and pushed prices up.
Unsurprisingly, we see that the month’s top performers were those able to respond to this new market dynamic, and shift their operating strategies to deprioritize DA energy, and lean in on RT energy and strategic AS bids.
Interesting day deep dives
The two highest revenue opportunity days in May looked nothing alike – highlighting the importance of a flexible operating strategy.
- May 16 saw a sharp Real-Time price spike that drove most of the day’s revenue.
- May 20 was dominated by high Non-Spin clearing prices. And, despite elevated Day-Ahead prices, DA energy made up a small slice of the overall stack.
These days illustrate how top operators adapt their strategies to capture value from different market conditions. Whether that’s leaning into Real-Time volatility or capitalizing on AS premiums, every day in ERCOT is different and strategies need to be agile enough to react.
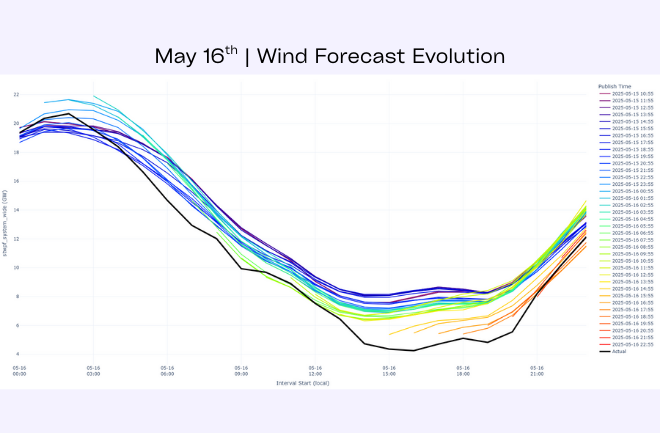
May 16, 2025
On May 16th, Real-Time energy prices spiked, clearing over $3,800/MWh at 7:45pm CT. We also saw elevated prices in the surrounding intervals, hitting around $400/MWh.
The spike was driven by a fairly classic combination of PV generation ramping down for the evening, thermal generation outages, and a wind forecast miss. We’ve seen low wind output be a consistent driver of price spikes in ERCOT this year, and 5/16 – where we had 40% wind underperformance compared to forecast – was just another example.
How did top energy storage systems operate?
Our platform, which accounts for wind risk when generating price forecast probabilities, anticipated the potential for high RT energy prices in the evening. Thus, it limited DA energy and AS bidding in the day ahead. For the same reason, the optimizer ensured batteries were fully charged going into the evening ramp down so we would have maximum capacity available to discharge should prices tick up.
With enough state of charge and a nimble dispatch strategy, we were able to discharge into the spike — earning $1.63/kW for the day.
As with most RT spike days, success hinges on both forecasting and flexibility: knowing when to reserve energy and capacity, and having a system that can execute quickly when prices rise.
Notably, only 22% of the ERCOT fleet discharged into the spike (assumes 11GW total nameplate capacity) — showing how few assets were positioned to capitalize.
May 20, 2025
May 20th showed a very different pricing dynamic. Non-Spin cleared unusually high from 7-9pm CT, peaking around $470/MWh at 8pm. Day-Ahead energy prices were also elevated during that window — over $500/MWh — but interestingly, DA energy comprised only 13% of fleet revenue, while Non-Spin made up 45%.
This suggests that many operators either didn’t anticipate the DA > RT premium, or saw more value in bidding into Non-Spin to preserve flexibility to also capture some RT energy revenue. That strategy created two paths to higher revenue:
- If RT energy prices cleared above $75/MWh, they could receive the Non-Spin capacity payment and still discharge into RT energy during the award window — effectively increasing their earnings.
Or, even if they were unable to dispatch into RT energy at the time of their award, they would only need RT energy to eventually clear at a price higher than the difference between DA and Non-Spin prices to beat the DA payout. Since DA energy cleared at $500/MWh and Non-Spin at $470/MWh, an operator would still come out ahead by dispatching into any RT hour that cleared above $30/MWh.
What did a top operating strategy look like?
This top performing North Load Zone asset had consistent ECRS and Non-Spin commitments throughout the day, including the high priced evening hours. They also complemented those AS awards with a DA energy commitment at the peak price.
Finally, the operator layered on some RT energy dispatch in the hour before for incremental revenue. All-in-all, this strategy net $1.23/kW hitting the highest priced products of the day at the right times.
May was a reminder that success in ERCOT isn’t about chasing a single product — it’s about matching strategy to market conditions. Whether that means reserving capacity for RT volatility, leaning into AS during tight days, or stacking products smartly across hours, the top operators were those able to adapt quickly and execute precisely. As summer heats up, that kind of flexibility will only become more valuable.
*Top earners defined as highest $/kW
**Top performers defined as highest percent of day-ahead TB2 captured
-
ERCOT Storage Performance
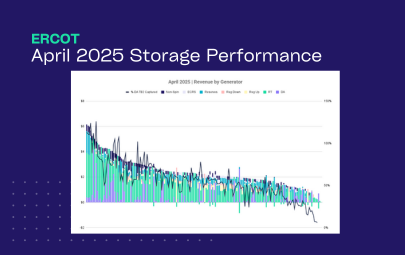
April 2025 Performance | ERCOT
07/15/25
-
ERCOT Storage Performance
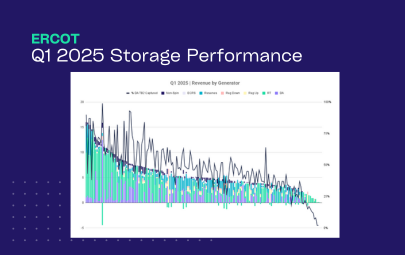
Q1 2025 Performance | ERCOT
06/26/25
-
ERCOT Storage Performance
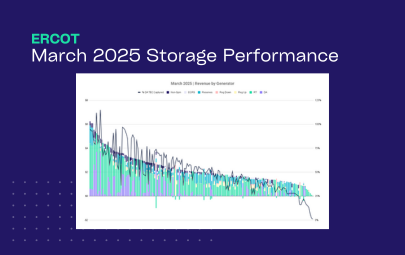
March 2025 Performance | ERCOT
06/17/25
-
ERCOT Storage Performance
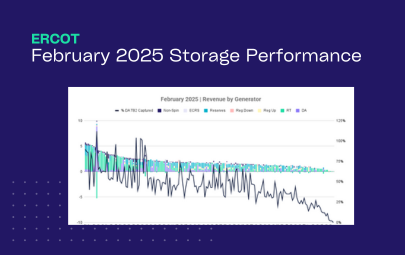
February 2025 Performance | ERCOT
05/13/25
-
ERCOT Storage Performance
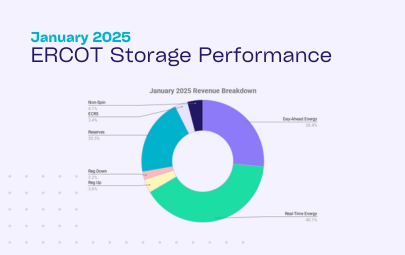
January 2025 Performance | ERCOT
04/28/25
-
ERCOT Storage Performance
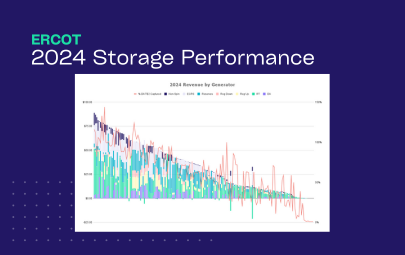
2024 Storage Performance | ERCOT
04/09/25
-

Guides
Benchmarking Energy Storage Performance in ERCOT: What Good Looks Like
02/24/25