ERCOT Storage Performance
ERCOT Storage Performance | July 2025
Looking back at storage asset operations and performance outcomes from July 2025.
From a distance, storage outcomes in July looked similar to months past – but zooming in we see marked differences in revenue composition, and the gap between the best and the rest continues to widen. Coincidentally, the fleet’s revenue average in July came in equal to June at $1.87/kW, despite the top 20 earners making ~19% more revenue. In a similar vein, the top 12 performers (measured by percent of TB2 captured) all beat the H1’25 top performer’s DA TB2 capture of 90%.
All in all, July presented an opportunity for storage operators – but only a select few assets were able to capitalize on it.
Revenue outcomes
Revenue results in July were widespread. Differences in strategy, as well as how much RT energy volatility each node experienced created a clear gap between the leaders and the median.
- Highest earning asset made $6.87/kW, while the top 50 revenue generators averaged $3.18/kW
- The median asset brought in $1.66/kW, with the fleet average slightly higher at $1.87/kW
- Ancillary Services (AS) fell from the top spot it held in May and June – and made up just 30% of fleet-wide revenue in July, while Real-Time (RT) energy reclaimed the lead with 38%
While the fleet’s revenue mix was relatively balanced, the top 50 earners concentrated revenue in energy. Some leaned heavily on Day-Ahead (DA) energy, while others relied on RT energy for the majority of their monthly earnings.
Asset performance
Day-Ahead energy cleared higher than RT energy during 65% of peak hours in July – and the top performers took advantage of these price premiums, capturing 47% of their revenue from DA energy.
We even see two of the highest performing assets that made nearly all revenue in DA energy take significant RT energy losses. This was likely due to the asset operators employing a virtual DART trading strategy. In practice, that means clearing DA energy positions, then choosing not to cover them in RT. When DA energy prices are higher than RT energy and an operator chooses not to discharge, they pocket the DA-RT spread without cycling – generating revenue while preserving SOC. Risky approach, but in this instance, it played out well for the operators.
- Top performing asset captured 194% of its DA TB2 opportunity, and the top 50 averaged 77%
- Median asset captured 45%, with the fleet average coming in similarly at 47%
These benchmarks help normalize for nodal volatility and shine a light on what really matters: how well did your asset convert the available opportunity into real revenue?
Interestingly, we see a very different revenue composition from the top revenue generators compared to the top performers.
- Top earners made their money almost equally from RT and DA energy, while top performers made the vast majority – almost half – in DA energy
- Top earners making almost 2x the revenue in RT energy compared to top performers, suggests they may have benefitted from more nodal volatility, presenting RT energy opportunity that much of the fleet didn’t have access to
- On the flip side, the top performers were more strategic in DAM bidding – evidenced by the higher DA energy and AS capture – so they could capture more of the opportunity available to them
In July, DA energy accounted for almost 2x the revenue it did in H1’25, and over 3x in 2024. Operators that seek top outcomes are having to be more agile than ever to keep up with these market shifts, and capture revenue where it presents.

Top earner vs. top performer
Two leaders ran two entirely different playbooks in July. One led the fleet in total revenue, the other led in DA TB2 capture. Their operating profiles differ, yet each made most of its money in RT energy.
First, the top revenue generator
July’s top grossing asset captured only 55% of its DA TB2 and 32% of its RT TB2, suggesting it left revenue opportunity on the table and had a meaningful RT over DA energy premium. It played to its node by leaning on RT energy, which accounted for 84% of revenue. And while this asset did bring in more revenue than others in the fleet, the low TB2 capture rates suggests it was not able to effectively capitalize on that volatility.
Diving into this asset’s day-to-day operations, we can see that it captured high revenue on a number of days early in the month – and had its highest grossing day on July 25th when RT energy prices at its node soared past $1,500/MWh. This all drove total revenue above ERCOT peers.
The top performing asset (measured by DA TB2 capture)
July’s top performer captured an exceptional 194% of its DA TB2, largely due to a single day. Remove July 2 and the battery’s DA TB2 capture falls to 56%.
The asset’s DA TB2 opportunity was thin at $2.16/kW, while its RT TB2 opportunity was much larger at $9.70/kW. The asset’s revenue opportunity was concentrated in RT, but the 43% of RT TB2 captured tells us it missed out on the majority of the opportunity available.
When digging into this energy storage system’s daily bid profiles, the story becomes even more interesting. On its standout day, it hit a rare mid-afternoon price spike almost perfectly. Every other day of the month, it bid into Reserves across the majority of hours – and more or less just sat there.
While this proves that a single day can swing the outcome for an entire month – more proactive daily optimization could have bolstered revenue and performance even further and reduce dependence on a single anomaly.
Here’s a deeper look.
July 2nd presented an unusual midday RT energy price spike at the top performer’s node. The asset charged from 6-10am, likely to build SoC in advance of its AS positions and potentially in anticipation of the RT spike. From 1-4pm total Physical Responsive Capability across ERCOT were normal levels, around 10GW, but RT energy prices at this asset’s node surged to over $3,500/MWh likely due to localized congestion. The asset timed discharge well, capturing the spike, and booking $3.00/kW, 71% of its July revenue in that three hour period.
The rest of the month, the asset followed a different type of operating plan. July 28th is a good example of how the asset operated on most days in July, sitting in Reserves even as prices crept up. That conservative stance may have reflected a choice to preserve asset health – or limits in real-time optimization and execution. But either way, it inhibited revenue capture.
Interesting day deep dive
In July, fleet revenue crossed $0.10/kW only four times, and July 30th was the outlier at $0.32/kW.
July 30th, 2025
Consistent with July’s pattern of DA energy premium over RT energy during peak hours, on July 30th DA energy prices cleared at $500/MWh from 7-9pm and made it the highest earning day of the month.
How did the top energy storage system operate?
The operator forecast the spread before the day began and positioned for an evening DA energy premium. On the operating day, the operator’s strategy was simple. They charged from 8-11am to secure SoC preparing for its evening DA energy positions. They then discharged from 7-9pm as DA cleared at $500/MWh, capturing $1.44/kW.
That one day delivered 24% of July revenue, underscoring that the rest of the month was steady and that one strong execution window can carry outsized weight.
-
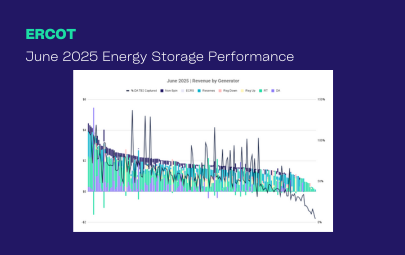
ERCOT Storage Performance
June 2025 Performance | ERCOT
09/16/25
-
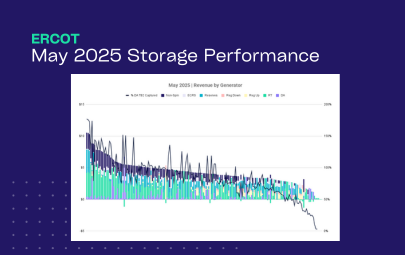
ERCOT Storage Performance
May 2025 Performance | ERCOT
08/12/25
-
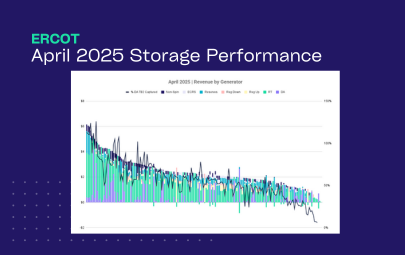
ERCOT Storage Performance
April 2025 Performance | ERCOT
07/15/25
-
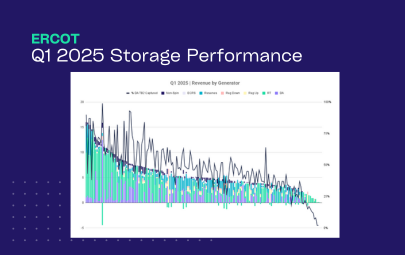
ERCOT Storage Performance
Q1 2025 Performance | ERCOT
06/26/25
-
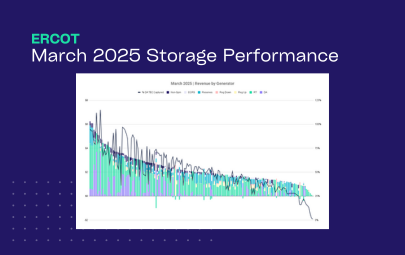
ERCOT Storage Performance
March 2025 Performance | ERCOT
06/17/25
-
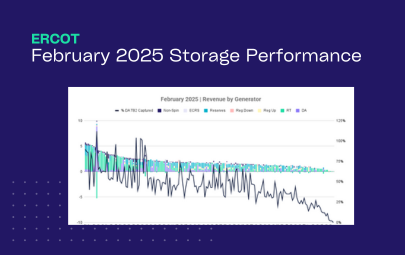
ERCOT Storage Performance
February 2025 Performance | ERCOT
05/13/25
-
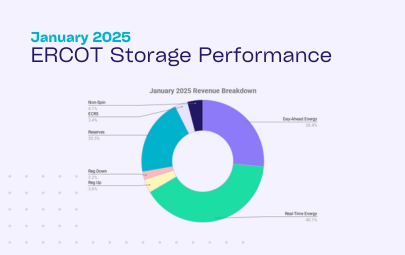
ERCOT Storage Performance
January 2025 Performance | ERCOT
04/28/25
-
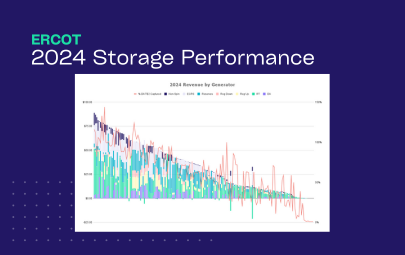
ERCOT Storage Performance
2024 Storage Performance | ERCOT
04/09/25
-

Guides
Benchmarking Energy Storage Performance in ERCOT: What Good Looks Like
02/24/25