ERCOT Storage Performance
ERCOT Storage Performance | August 2025
Looking back at storage asset operations and performance outcomes from August 2025.
August is a peak summer month in Texas. With higher heat came higher electricity demand and higher revenue opportunity for ERCOT energy storage operators.
The fleet average revenue rose 11% from July, though the average performance remained almost steady at 45% Day-Ahead TB2 capture. The jump in earnings without much change in TB2 capture rate suggests price spreads increased month-over-month, but the ERCOT fleet didn’t do a great job capturing the increased opportunity.
Revenue outcomes
While revenue was up on average, August’s top revenue generating asset stood out from the rest of the fleet, netting 45% more revenue than the next highest earning asset. While, at first glance, this seems impressive, the data tells a different story. In fact, this top earning asset experienced a Real-Time TB2 opportunity over 5x the second revenue generator’s opportunity – and only captured 38% of their RT TB2 (more on that later).
The rest of the top earning assets had revenue outcomes more in line with what we see month-over-month. The top 10 assets all exceeded $4.50/kW of revenue, and, other than the leader, had high RT and DA TB2 capture rates.
- Highest earning asset made $9.96/kW, while the top 50 revenue generators averaged $3.64/kW
- The median asset brought in $1.90/kW, with the fleet average slightly higher at $2.08/kW
- Energy made up 70% of revenue, with Day-Ahead (DA) energy contributing the majority at 36% and overtaking July’s Real-Time (RT) energy lead
From an operating strategy perspective, we can see that top earners made the vast majority of their revenue in energy. However, operators were split between DA and RT dominant approaches. What did they have in common? Ancillary Services (AS) were used to supplement revenue, not relied on as the primary revenue generating strategy.
Asset performance
August saw a small group of strong performers, with the top 20 assets capturing an average of 92% of their DA TB2 – 2x the fleet average. These top performers captured the majority of their revenue from DA energy – similar to the full fleet – but quite literally doubled down on what was working for this month. In fact, the top 20 performers generated 69% of their revenue from DA energy, almost double the ERCOT fleet, which captured 36% of revenue from DA energy overall.
- Top performing asset captured 189% of its DA TB2 opportunity, and the top 50 averaged 74%
- Median asset captured 43%, with the fleet average coming in similarly at 45%
These benchmarks help normalize for nodal volatility and shine a light on what really matters: how well did your asset convert the available opportunity into real revenue?
Similar to the top revenue generator, the top performer (measured by DA TB2 capture) made the majority of its revenue in RT energy and benefited from a nodal anomaly. This asset experienced some localized congestion, experiencing a rare mid-day ~$2,500/MWh price spike on August 27th. The operator was able to dispatch into the spike, and within 5 hours, made 63% of their August revenue.
The story isn’t “the leaders got lucky.” Although the top performing asset had a leg up with rare nodal activity, they were able to identify the opportunity and flex their operating strategy to capture it. Agility is key.
Asset performance by duration
Assets of different durations took very different approaches to achieve top performance. At a high level, we see shorter duration assets rely much more heavily on Ancillary Service products. In fact, in August AS comprised ~50% of the revenue of assets with durations under 1.1 hours, compared to just 17% for assets over 1.6 hours. Accordingly, as duration increases, the percentage revenue from energy arbitrage does as well.
This trend is magnified when we zoom in on the top 10 performing assets (measured by TBx captured) in each duration group. We see an increasing percentage of revenue come from energy products. And, specifically in August, we see DA energy play a dominant role, accounting for nearly half of the revenue for top performing assets over 1 hour in duration.
Diving a bit deeper into the specific operating strategies of these assets. We find that:
- The vast majority of short duration assets around 1 hour are bidding into AS and then layering in a bit of energy on top of that.
- Mid-duration assets made 76% of their revenue in energy, with the top performers leveraging DA energy more heavily.
- The longer duration assets relied almost exclusively on energy. Top performers leveraged DA energy, which saw a premium to RT most of the month, more than the average 1.6 hour+ asset.
*Shorter duration is <1.1 hr duration. Mid duration is 1.1-1.6 hr duration. Longer duration is 1.6-2+ hr duration.
While assets of all durations benefit from accurate forecasts to call the highest priced products in the highest priced hours, longer-duration assets benefit from more flexibility. Their extended duration gives them more opportunities to capture high priced intervals that get their total revenue up. For this reason, it makes sense for them to bet more on energy – as prices tend to be higher overall and they have a greater ability to capture the premiums.

Summer heatwave brings revenue opportunity
Texas summers bring heat and higher revenue opportunities to ERCOT energy storage operators. As expected in summer months, energy made up the majority of revenue in July and August due to increased demand driving prices up.
Specifically for August, Day-Ahead energy took a more defined role:
- The majority of revenue was made in DA energy (36%), whereas RT energy led the pack in July
- DA energy cleared higher than RT energy during 64% of peak hours
- Top 20 performers captured 70% of their revenue from DA energy
- Top 20 revenue generators captured 60% of their revenue from DA energy
- DA energy revenue share is climbing from 9% in 2024 to 16% in H1’25 to 36% in August 2025
We also see in the revenue mix the (close to) top performers and bottom performers made nearly all revenue in DA energy, but took significant RT energy losses. This can mean the asset:
- Prioritized DA energy and Ancillary Services (AS), and we are seeing RT energy charging costs.
- Employed a virtual DART trading strategy – clearing DA energy positions, then choosing not to cover in the RT to pocket the DA-RT spread without cycling (a riskier approach).
The DA energy premium likely implies ERCOT took a conservative approach when forecasting load and net load on tighter condition days. On these days, ERCOT procured more capacity in DA than RT conditions ultimately required, creating a DA > RT premium.
Daily breakdowns and nodal pricing variation
Revenue opportunities in August were spread more evenly across the month – reminding us that operating strategies must stay agile and be customized to the conditions of the day to achieve top outcomes.
There were, however, 3 consecutive days where revenue was relatively higher, coming in around $0.15/kW. This could be due to a number of factors including the temperature rising over 100°F on the 18th and 19th, and thermal generation taking a dip from August 17th-20th. The top revenue generators on these days vary between the top two revenue generators for the month. Interestingly though, these two West Load Zone assets saw completely different pricing dynamics – with RT energy prices spiking at different times, leading to varied operating strategies.
As previously hinted at, the top revenue generator of the quarter benefitted from an extreme nodal anomaly during this time period. The node experienced sustained, high overnight energy prices for 8 consecutive days from August 17th – 25th. RT energy prices reached up to $1220/MWh in this period and DA energy prices reached up to $537/MWh.
In comparison, the second highest earner (not at the same node, but also located in the West Load Zone) experienced a more typical price shape, along with lower overall energy price peaks. In fact, the highest energy price at their node was 4x lower – a $310/MWh DA energy price spike on August 19th evening during normal peak hours. Notably, the #2 revenue generator captured more of their revenue opportunity – 128% of their DA TB2 – throughout the month.
Interesting day deep dive
While revenue was fairly consistent throughout August, there was one three day stretch where the fleet captured more revenue than the average day. Let’s dig into one of those peak days, August 19th, to unpack how nodal pricing differences can impact operating strategy.
August 19th, 2025
Double clicking into August 19th, the top earner of the fleet, located in the West Load Zone, experienced very different pricing dynamics than the majority of assets. Let’s compare their day and operating strategy to the top earner in the North LZ, whose strategy is more representative of the modal asset on 8/19.
The North LZ battery experienced a more typical day with an evening DA energy price peak of ~$300/MWh from 7-9pm.
The top generator experienced the same DA energy prices in the evening PLUS elevated RT and DA energy prices from 12-7am – similar to what they had been seeing the past few days. During this middle of the night peak, prices reached up to $583/MWh.
How did a high performing asset with more typical pricing dynamics operate on August 19th?
Prior to the August 19th operating day, the operator cleared positions in DA energy across the evening peak from 7-9pm.
Day of, the operator charged throughout the morning and early afternoon – gaining SOC so they were in position to deliver on their DA energy obligations. They then discharged perfectly into the evening peak, capturing the ~$300/MWh DA energy prices. The asset then discharged their remaining capacity into RT energy in the hours following. This net them $0.43/kW on the day.
How did the fleet’s top revenue generator of August operate on August 19th?
The month’s top revenue generator took an approach more adept for the middle-of-the-night price volatility they had been experiencing. They began the day with high SOC and appeared to await high RT energy prices. While they missed relatively high print at midnight ($475/MWh) and 2am ($422/MWh), they did hit the absolute peak of $583/MWh at 4am.
Then, from 5-9am, the asset continued to discharge into RT energy, despite prices dropping off. All in all, they made $0.17/kW – half of their day’s revenue in this period. The asset then recharged through the late morning and early afternoon dip. The asset made the rest of their day’s revenue from AS awards. They did not bid into relatively high DA energy prices in the evening, likely prioritizing RT energy given the volatility they had been benefiting from.
Finally, at 11pm, they captured a small portion of the elevated RT energy price, bringing asset to a total of $0.34/kW on August 19th.
While the operating strategies looked very different – both operators employed operating strategies that made sense for their nodal pricing dynamics.
This all goes to show that operating strategies can’t be set-it-and-forget-it, nor can they be one-size-fits-all if you want to maximize revenue and performance. Anomalies present opportunities, and having an optimizer dynamic enough to capture them is key.
*Top earners defined as highest $/kW
**Top performers defined as highest percent of DA TB2 captured
-
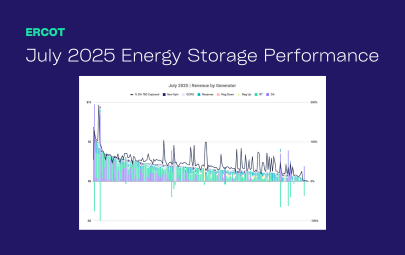
ERCOT Storage Performance
July 2025 Performance | ERCOT
10/15/25
-
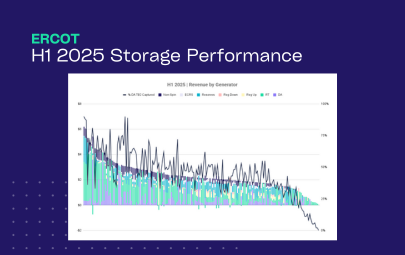
ERCOT Storage Performance
H1 2025 Performance | ERCOT
09/16/25
-
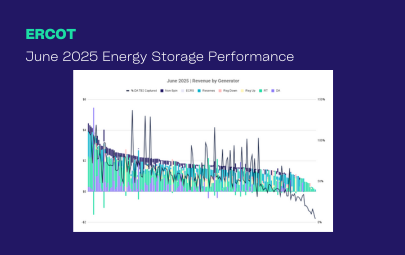
ERCOT Storage Performance
June 2025 Performance | ERCOT
09/16/25
-
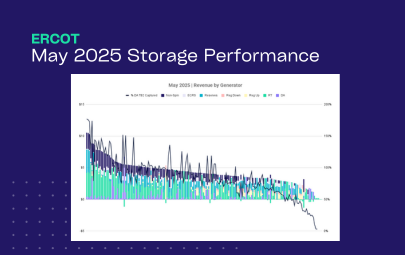
ERCOT Storage Performance
May 2025 Performance | ERCOT
08/12/25
-
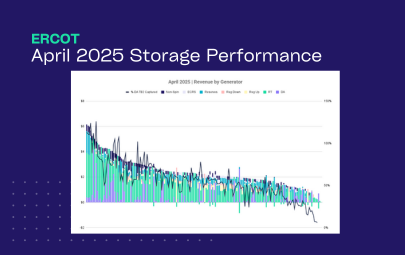
ERCOT Storage Performance
April 2025 Performance | ERCOT
07/15/25
-
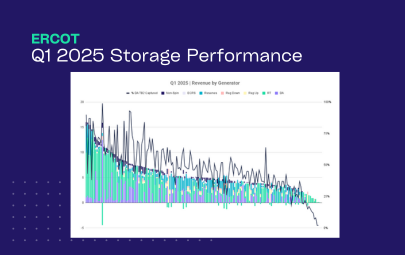
ERCOT Storage Performance
Q1 2025 Performance | ERCOT
06/26/25
-
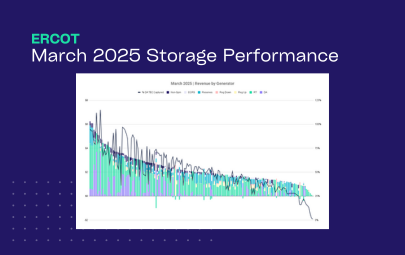
ERCOT Storage Performance
March 2025 Performance | ERCOT
06/17/25
-
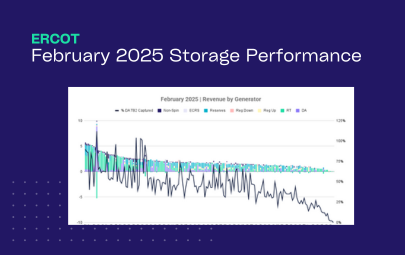
ERCOT Storage Performance
February 2025 Performance | ERCOT
05/13/25
-
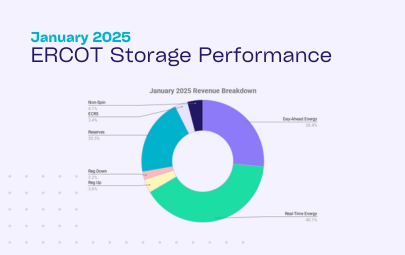
ERCOT Storage Performance
January 2025 Performance | ERCOT
04/28/25
-
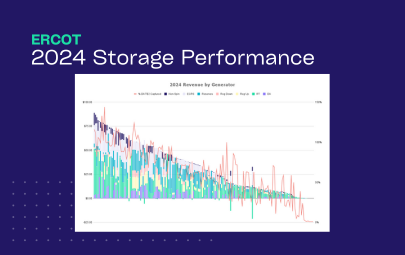
ERCOT Storage Performance
2024 Storage Performance | ERCOT
04/09/25
-

Guides
Benchmarking Energy Storage Performance in ERCOT: What Good Looks Like
02/24/25