ERCOT Storage Performance
ERCOT Storage Performance | April 2025
Looking back at storage asset operations and performance outcomes from April 2025.
April continued the trend we’ve seen all year: Real-Time (RT) energy is making up more and more of the revenue stack for battery energy storage systems in ERCOT. RT energy made up 50% of total fleet revenue this month — up from 43% in Q1 and nearly double its contribution throughout 2024. For top-performing assets, RT energy was even more critical, accounting for ~60% of their revenue.
We also see a stronger correlation between revenue and performance outcomes this month. The top 20 revenue generating assets, on average, made $4.75/kW and captured 89% of their DA TB2 and 64% of their RT TB2. Meanwhile, the 20 top performing assets made $4.39/kW and also captured 99% of their DA TB2 – and managed a 71% RT TB2 capture. This all indicated that the top earners likely have more RT volatility – and therefore more money to be made – but did a slightly inferior job capturing the opportunity available.
Revenue outcomes
Revenue outcomes varied widely in April, reflecting both differences in strategy and exposure to energy price volatility.
- Highest earning asset made $6.15/kW, while the top 50 revenue generators averaged $3.82/kW
- The median asset brought in $2.23/kW, with the fleet average was slightly higher at $2.44/kW
- ~50% of total revenue came from RT energy, though for the top 50 earners this jumps up to 60% (58% for top performers)
Asset performance
This month, we saw notable alignment between the revenue stacks of top earners and top performers. Both made ~60% of revenue in RT energy, underscoring the growing importance of highly responsive forecasting and optimization to capture RT price spikes.
While the majority of top performers leaned heavily on RT energy, a subset also incorporated more Day-Ahead (DA) energy — demonstrating that a well-executed DAM play can meaningfully boost outcomes, especially given DA energy prices often clear higher than RT energy during peak intervals.
For true optimization, assets must take advantage of all revenue opportunities. This means not only reacting to RT volatility, but accurately forecasting and clearing DA awards when the setup is favorable.
Performance was up month-over-month:
- Top asset captured 126% of its DA TB2 opportunity, and the top 50 averaged 83%
- Median asset captured 54%, with the fleet average coming in at 56%
These benchmarks help normalize for nodal price volatility and reveal how well an asset executed its operating strategy. In short: how much of the revenue opportunity available at your node did you actually capture?
Once again, April showed a sharp divide between a small set of high-performing assets and the broader fleet. Most storage systems are still leaving significant revenue on the table:
- 70% of assets captured between 20%-40% of their RT TB2
- 70% captured <50% of their DA TB2
Finally, all energy storage systems that performed above median made the majority of their revenue in RT energy. Those that demonstrated top performance went further, though. They paired strong RT execution with targeted use of DA energy and Ancillary Services (AS) — demonstrating more complete stack participation and a more proactive approach to revenue capture.
Top asset operating strategies
We analyzed bid plans and revenue outcomes for the top three earning assets in each ERCOT zone to understand how leading operators are approaching the market.
A few themes emerged:
- Many still place aggressive AS bids, despite AS accounting for a minimal portion of actual revenue.
- The system demonstrated a dual peak, and RT energy accounted for the vast majority of revenue in both.
- DA energy still plays an important role — especially in the evening peak — where prices often clear above RT, offering a solid arbitrage opportunity for well-forecasted assets.
- Output essentially traced energy awards, indicating that AS deployments – and associated substantive revenue – were minimal.
Interesting day deep dives
There were six days in April where storage fleet revenue exceeded $1M. April 7th and April 20th were the standouts, with revenue exceeding $3.5M and $2.5M respectively. In both instances, the majority of fleet revenue came from RT energy, driven by high RT energy price spikes.
April 7, 2025
The month’s standout day was, by far and away, April 7th. In the morning ramp, around 7am, we saw RT energy price spike above $4,000/MWh across ERCOT.
How did top energy storage systems operate?
One of April’s top-performing assets captured the RT energy price spike on April 7th effectively. It began the day with no AS commitments — a reflection of its consistently energy-forward strategy throughout the month. In April, the asset earned 77% of its revenue from RT energy and 21% from DA, rarely leaning on Ancillary Services.
Note: with this energy-centric approach, the asset finished the month as the second highest earner in the Houston LZ, just behind an asset that made 15% of revenue in AS (vs. this asset’s 2%).
On the 7th, the asset:
- Charged during the early morning (1–3am)
- Discharged about half of its capacity into the morning peak, including the 7am interval where the average hourly price was ~$1,720/MWh
- Recharged midday and dispatched again during the evening peak, when prices held above $100 from 7–9pm
This well-timed strategy earned the asset $1.37/kW for the day.
How to go wrong on a day like 4/7?
Charge into the spike. Or mismanage SOC so you’re unable to cover DA obligations.
Not every asset navigated the morning spike well. In fact, the North Load Zone’s top earning asset in April took a big hit due to poor state of charge (SOC) management.
How the day unfolded:
- The asset cleared most of its capacity into DA energy in the Day-Ahead Market (DAM).
- However, the asset started the day with almost zero SOC, and took limited charge actions in the early morning hours.
- As a result, it was unable to discharge during the 7am and 8am intervals, despite having DA awards.
- This forced the operator to buy back those positions at RT prices, which averaged above $1,500/MWh that hour
This led to extreme losses – ending the day with -$0.89/kW.
This highlights the risk of treating DA participation as a set-and-forget strategy. Without robust SOC management and contingency planning, DA exposure on volatile days can quickly turn from opportunity to liability.
At Tyba, our optimizer plans the DAM bidding strategy with this uncertainty in mind – ensuring assets can deliver or adapt when volatility hits.
April reinforced the direction ERCOT has been heading all year – RT energy is where most of the money is made, and performance depends on more than just volatility exposure. The best results came from assets that combined accurate forecasting, flexible dispatch, and disciplined SOC management across both RT and DA markets.
*Top earners defined as highest $/kW
**Top performers defined as highest percent of day-ahead TB2 captured
-
ERCOT Storage Performance
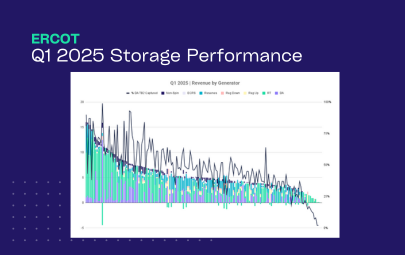
Q1 2025 Performance | ERCOT
06/26/25
-
ERCOT Storage Performance
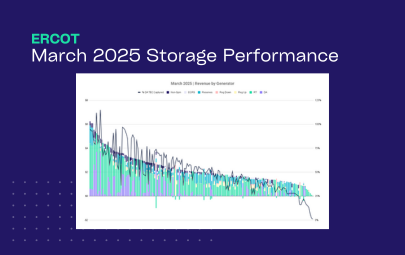
March 2025 Performance | ERCOT
06/17/25
-
ERCOT Storage Performance
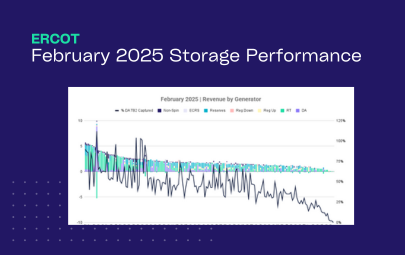
February 2025 Performance | ERCOT
05/13/25
-
ERCOT Storage Performance
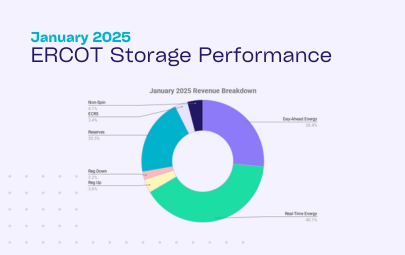
January 2025 Performance | ERCOT
04/28/25
-
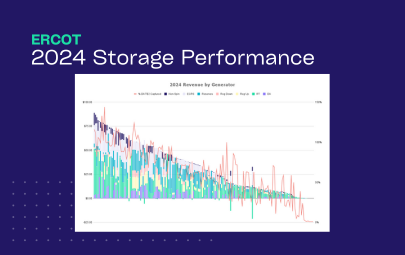
ERCOT Storage Performance
2024 Storage Performance | ERCOT
04/09/25
-

Guides
Benchmarking Energy Storage Performance in ERCOT: What Good Looks Like
02/24/25