Context
Renewable energy projects often have long development lifecycles (2-5+ years) that require the developers of and investors in those projects to make key commercial, financial, and technical decisions years before projects become operational. Developers and investors are left to navigate uncertain future market, regulatory, and supply chain dynamics. With the near endless array of potential commercial and technical design considerations, this presents a major modeling challenge for developers to understand if a project pencils and under what scenarios. This blog post explores how developers and investors can leverage Tyba’s software platform to optimize and future-proof the design of projects.
IRA a catalyst for re-evaluating pipeline & design decisions
With the passage of the Inflation Reduction Act (IRA), developers and investors are revisiting their project pipeline to account for new considerations such as:
- Should I add energy storage to my project?
- Does grid charging allow me to make the economic case for upsizing the storage capacity and/or duration of my project?
- Is the PTC preferable to ITC? Does boosting DC:AC ratios to capture additional PTC value make sense?
You need flexible modeling solutions that can handle the wide range of scenarios, that can be updated on the fly, and create a shared understanding organizationally of your project (risks and upsides). In the following case study, we will walk through how you can leverage Tyba’s web application and API library to scale your modeling efforts.
Case Study
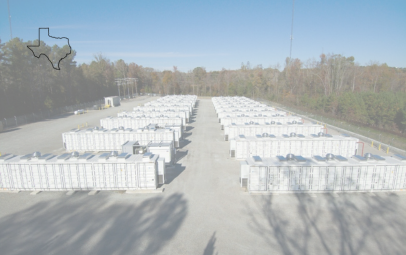
Hybrid Project in MISO
Prompt
You have a solar project in MISO’s interconnection queue. When initially submitting for interconnection, the plan was for this to be a solar-only project with 100 MWac and a 1.3 DC/AC ratio. With the IRA passage along with recent changes in MISO’s capacity market, your leadership team has come to you with the following asks and constraints.
Asks
- Should we add energy storage to this project?
- If so, how should storage be sized relative to solar? And what benefit do we get from DC-coupling and enabling grid charging?
- How sensitive are the results to the assumed capacity rates? Does the move to a seasonal capacity market have an impact?
- What configurations meet your 6% IRR hurdle rate?
Constraints
- The project cannot exceed a 100 MW POI limit.
- The project has sufficient space to fit up to 150 MWdc of solar.
Step 1: Define the set of scenarios
Based on the ask, you want to evaluate the following set of design scenarios.
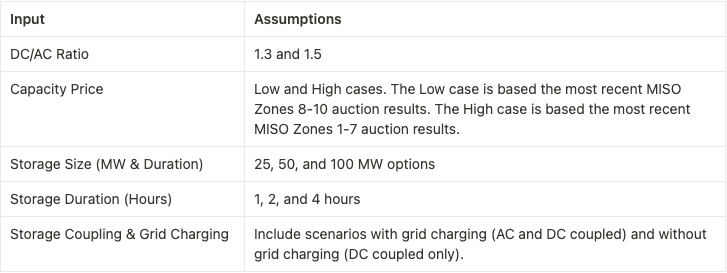
In total, this translated to 72 different design options. Inputs that are fixed across all options include solar capacity (AC), module, inverter, racking, irradiance, POI, storage cycle caps, degradation, market strategy (energy + capacity), energy prices used.
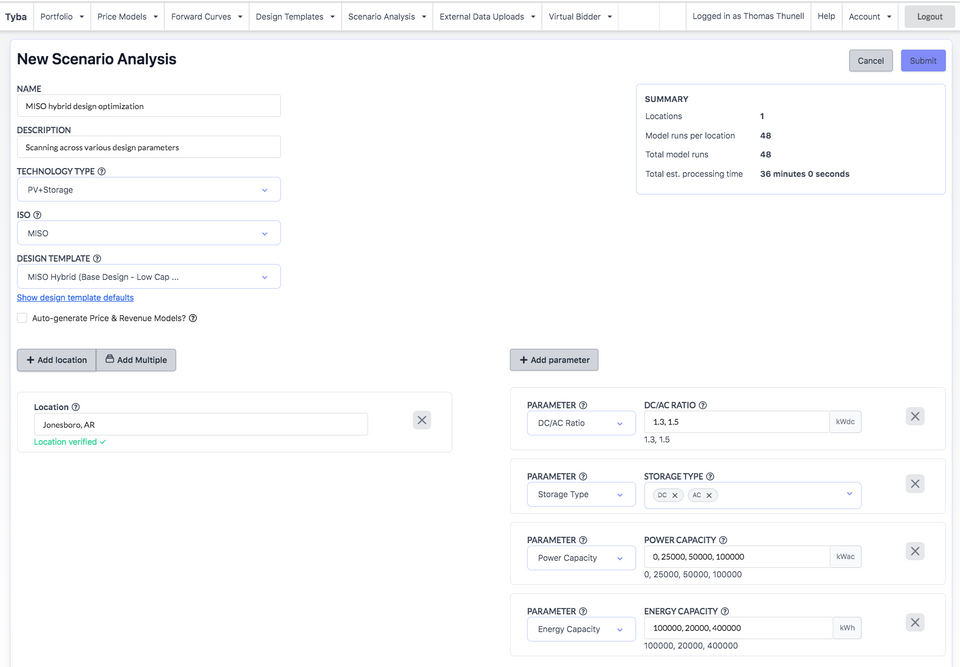
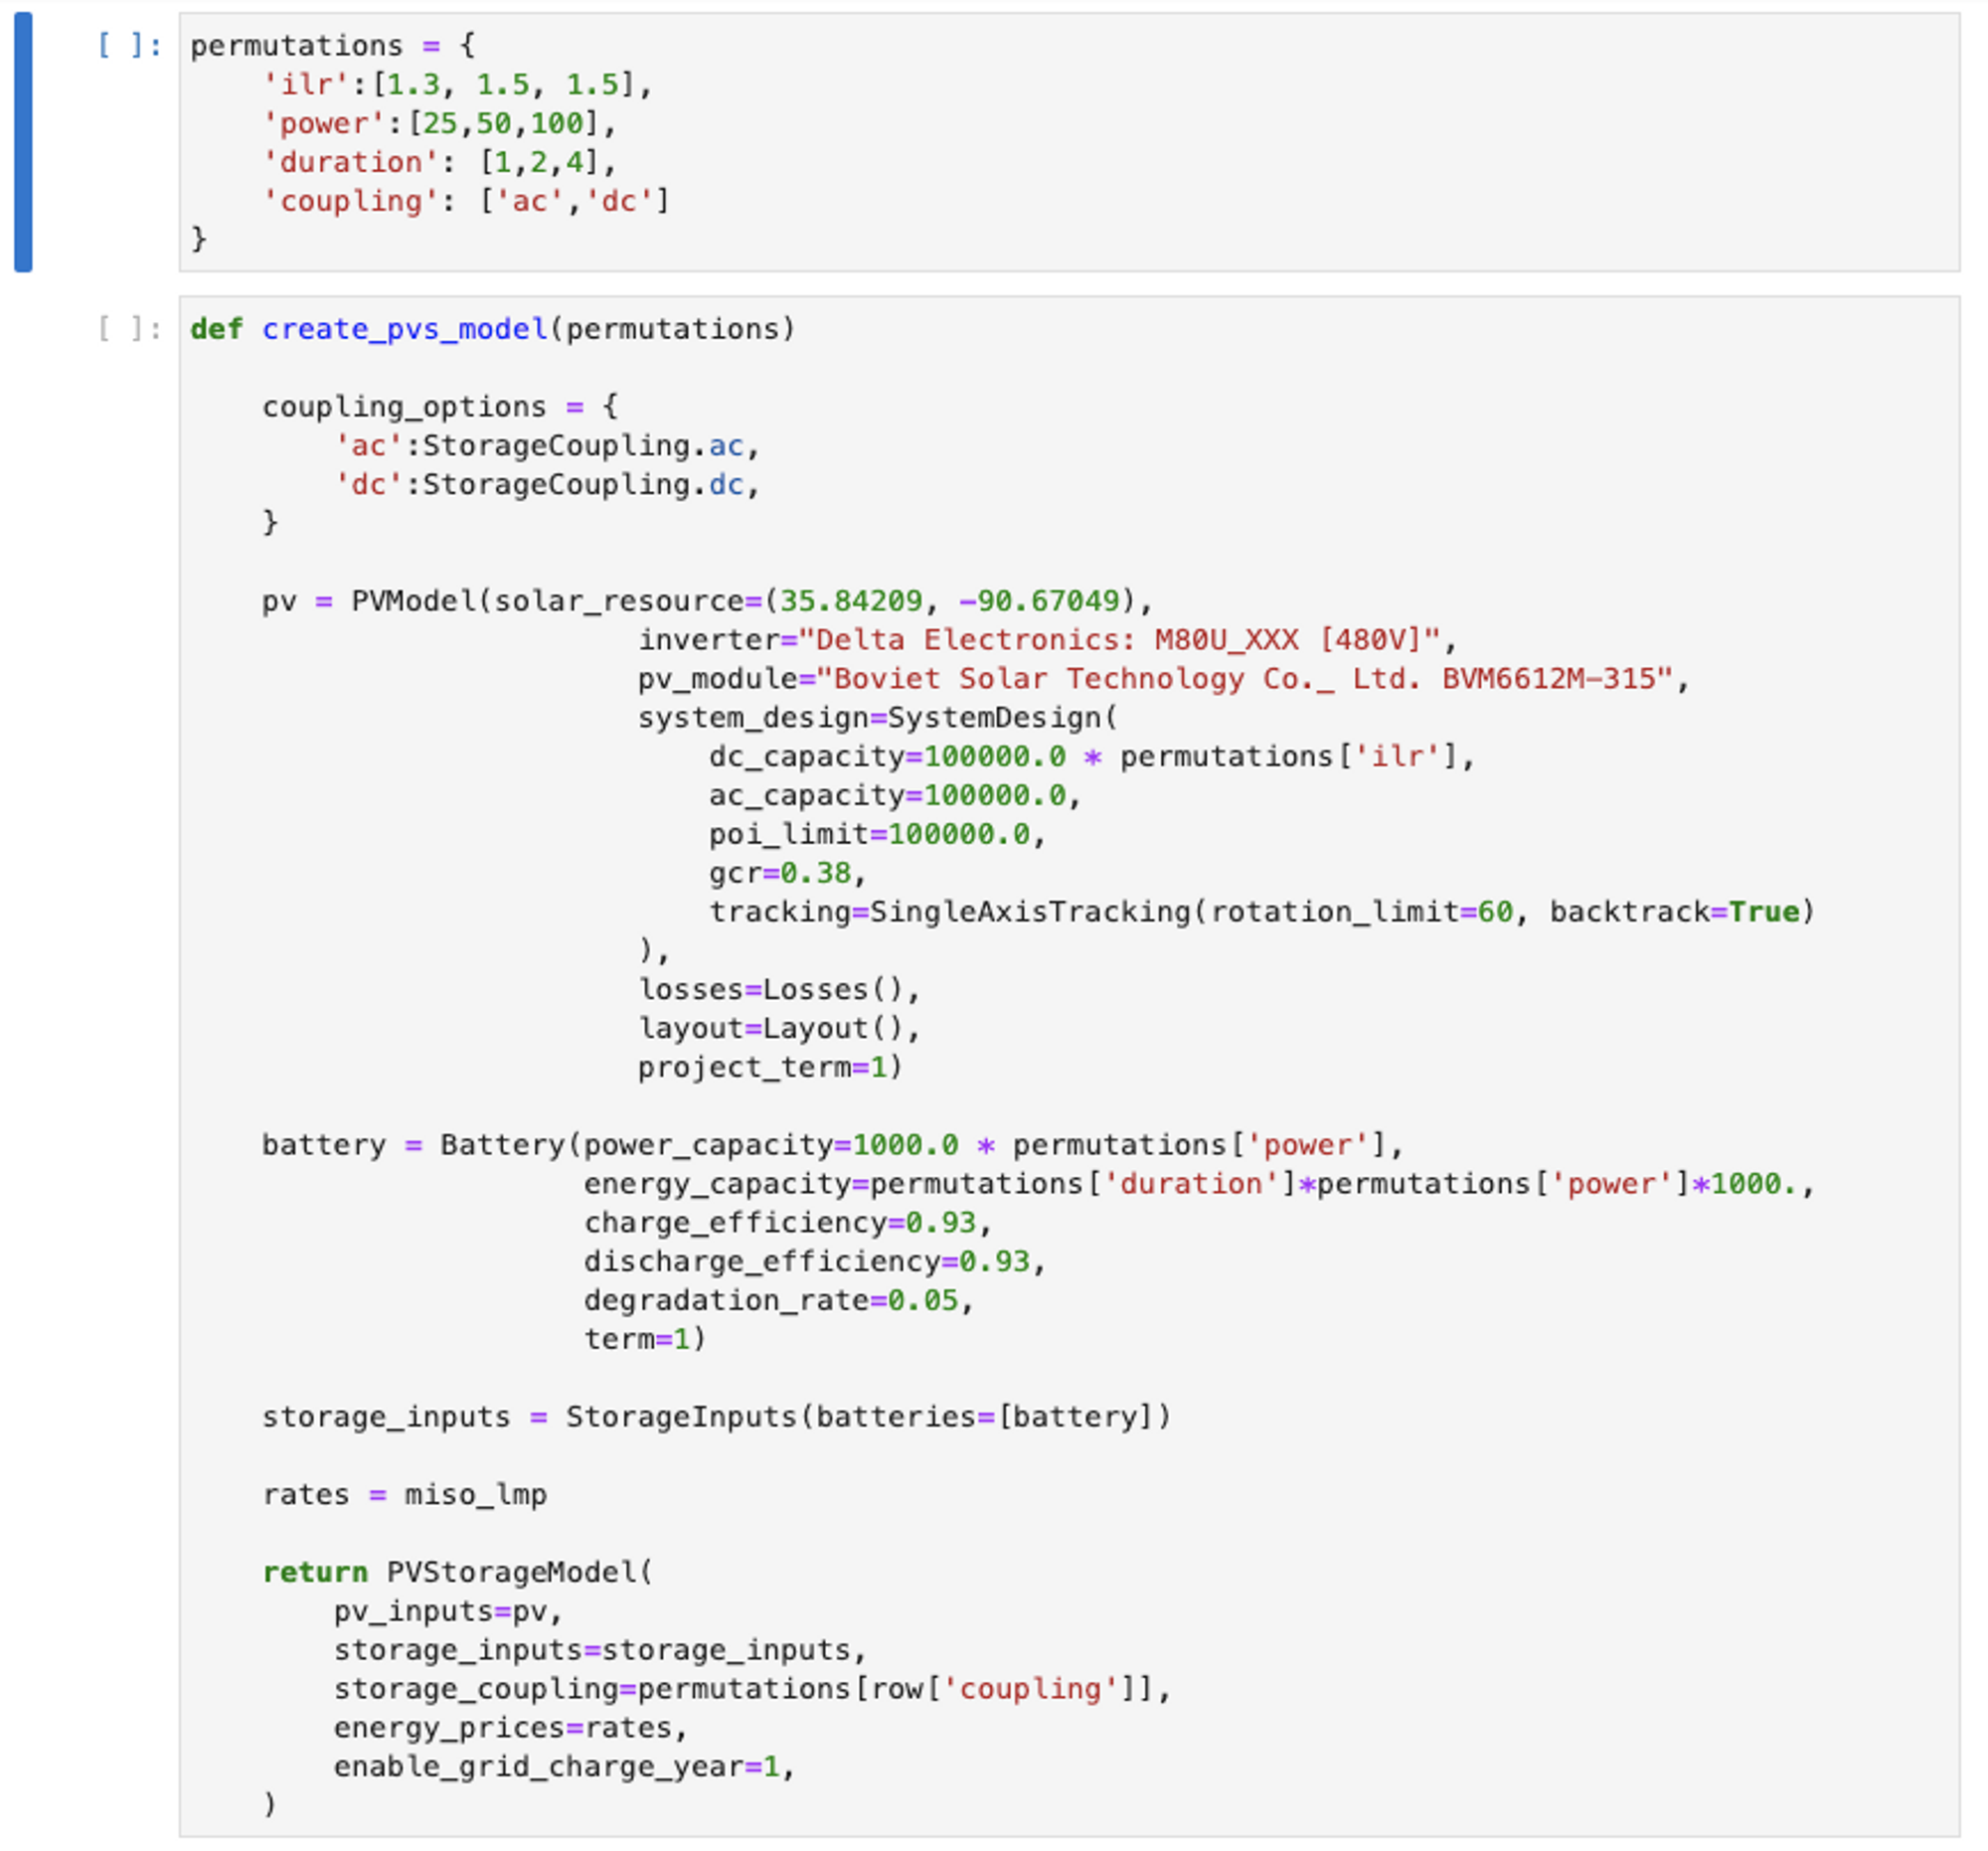
Step 2: Run the analysis
Through Tyba’s web app and/or API, it is easy to setup the the analysis.
Step 3: Review the results to inform your investment case
Now that we’ve run the analysis, it’s time to review the results and address the questions from your management team.
Q1: Should we add energy storage to this project?
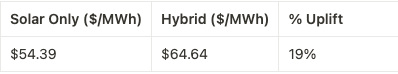
Average across all design variations, the hybrid designs provide a $10 per MWh revenue uplift compared to their solar-only counterparts. Let’s dive into this further to see how different market assumptions and design tradeoffs impact performance.
Q2: If so, how should storage be sized relative to solar? And what benefit do we get from DC-coupling and enabling grid charging?
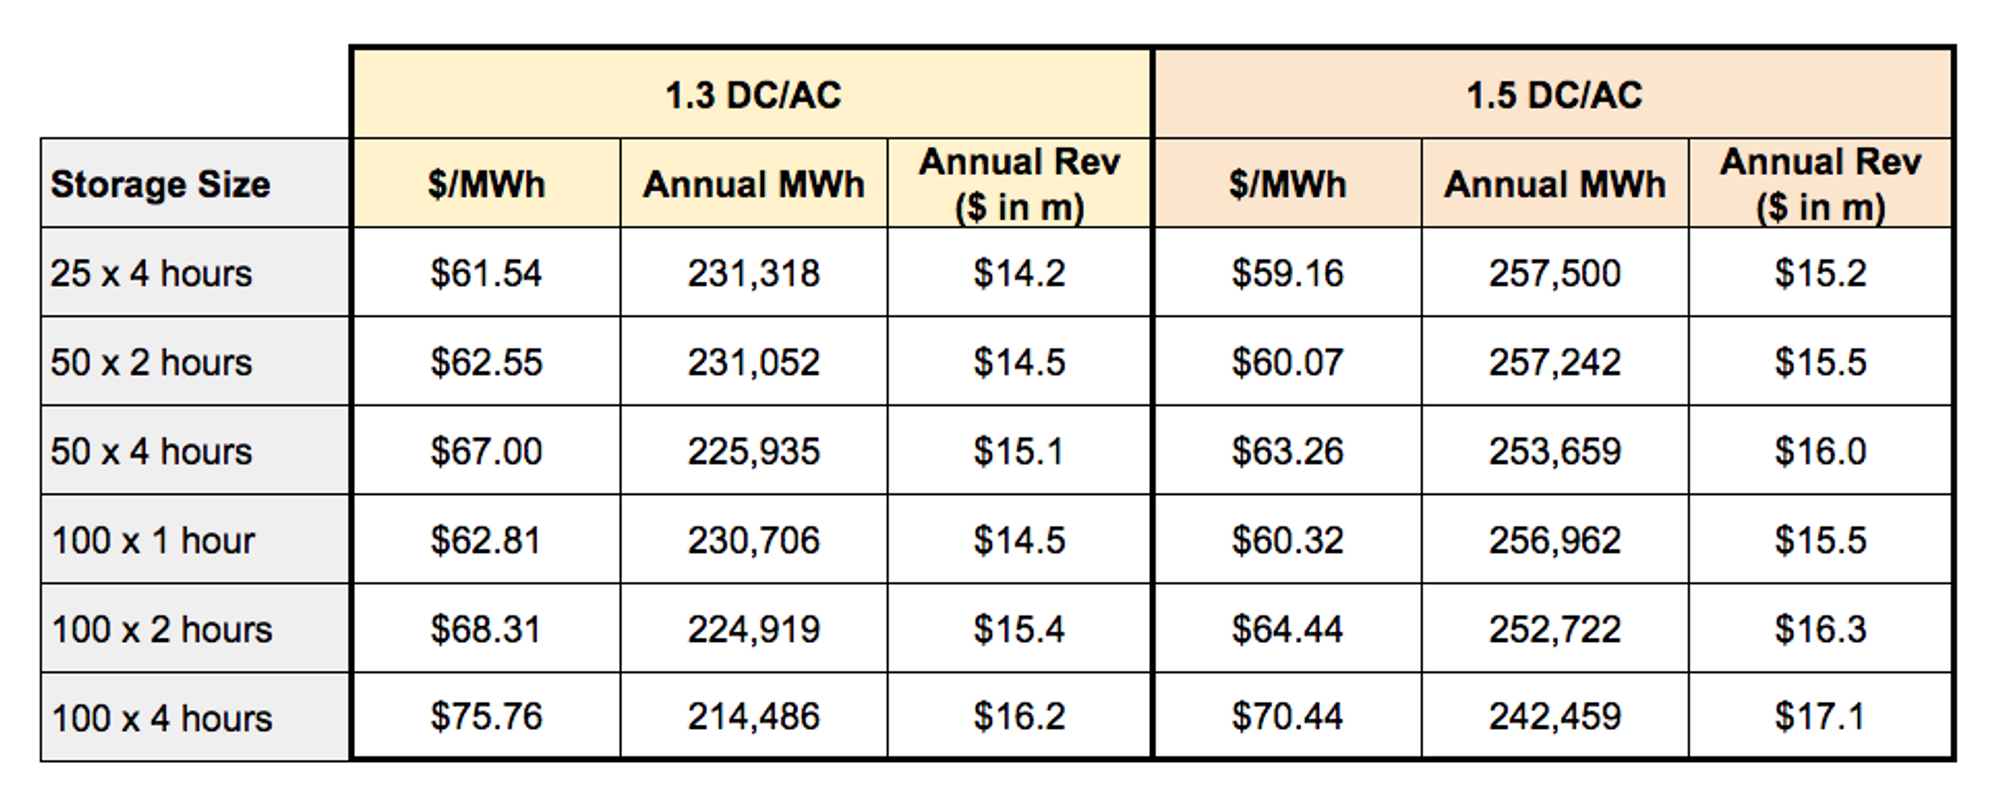
To help answer the first part of this question, we looked at a subset of the hybrid designs to see how the revenue ($/MWh blended rate and Year 1 total) and production (annual MWh) were impacted by changing the DC/AC ratio for solar and the storage capacity and duration.
Takeaways:
By increasing the DC/AC ratio from 1.3 → 1.5, we get a:
- ~$2/MWh increase & +10% production gain for the 100 MWh systems
- ~$4/MWh increase & +12% production gain for the 200 MWh systems
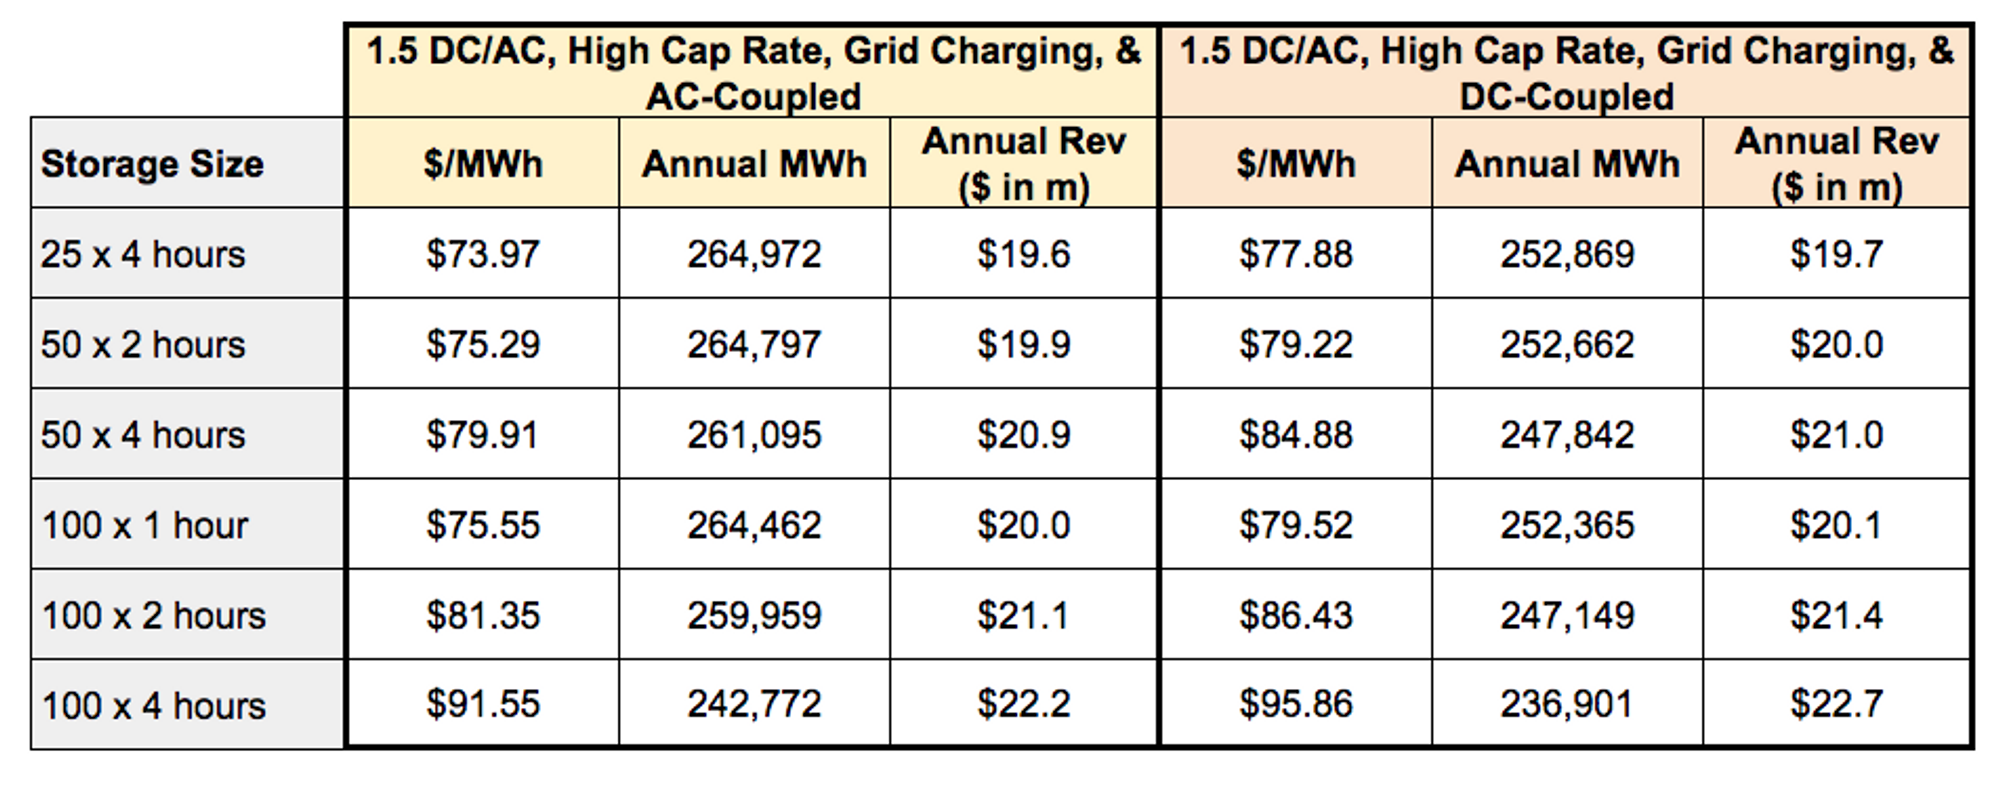
Next, we compared AC vs. DC coupled design options modeled under the high capacity case. The DC-coupled options have slightly higher revenue than their AC-coupled counterparts, and that differential increases as you increase storage capacity and duration.
Takeaways:
By switching from a AC → DC coupled system with grid charging, we get a:
- ~$4/MWh increase & <5% production hit for the 100 MWh systems
- ~$5/MWh increase & ~5% production hit for the 200 MWh systems
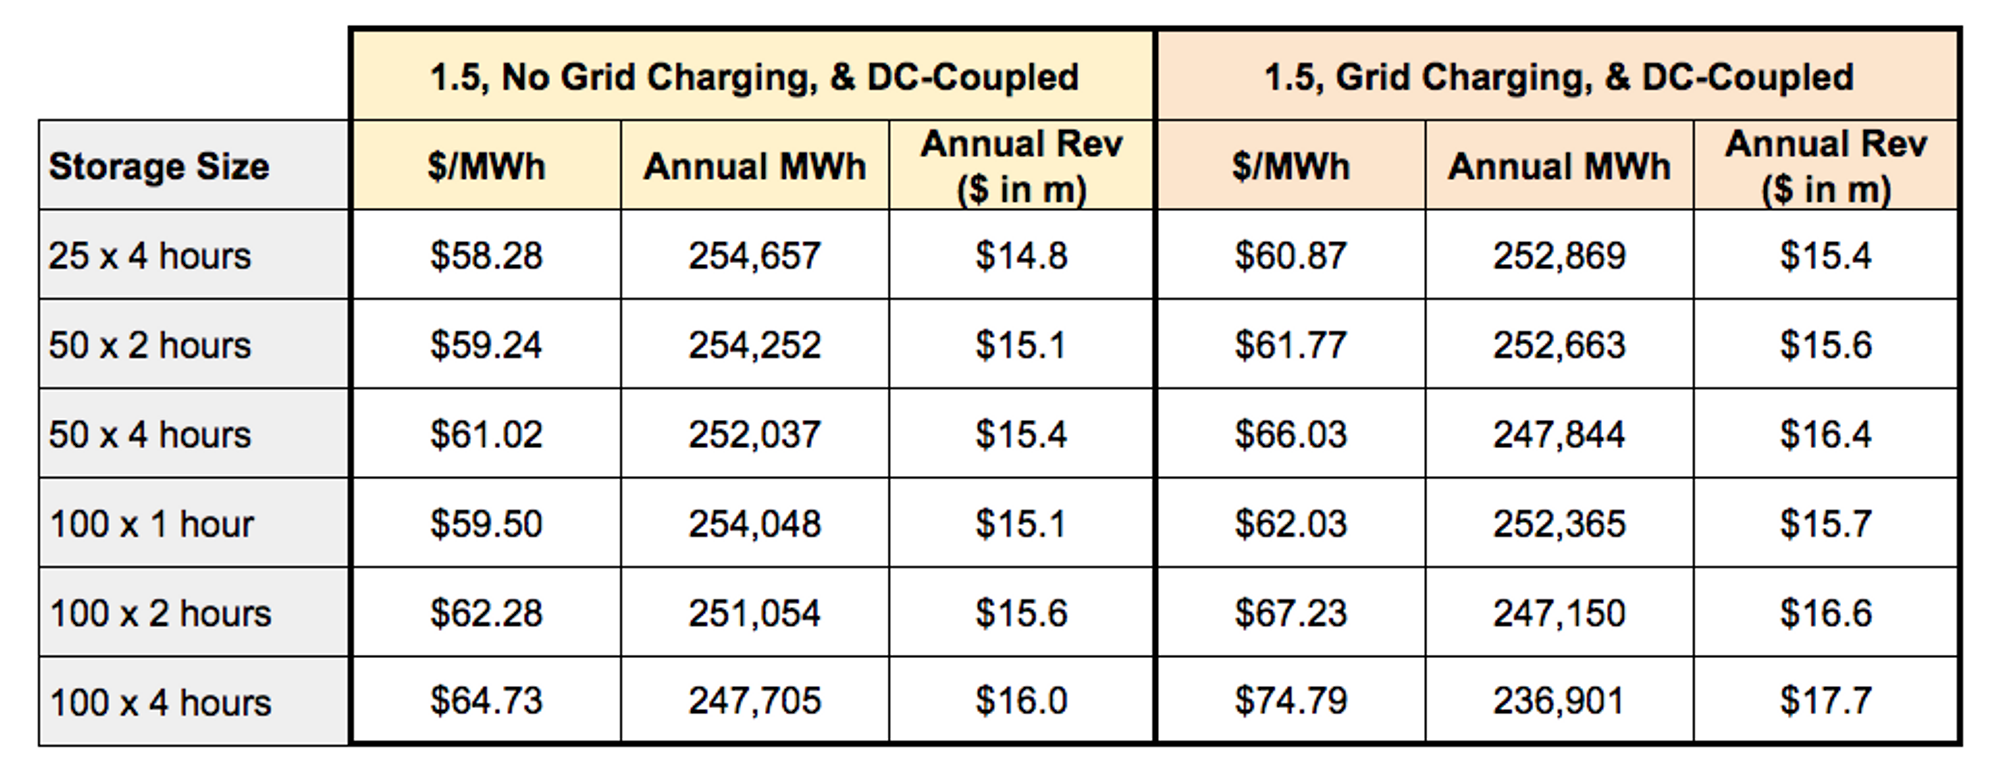
Finally, we compared the DC-coupled designs with and without grid charging enabled. We see a substantive increase in Year 1 revenue (4-10%+) by allowing grid charging. In particular, being able to grid charge provides flexibility to deliver during dual-peaking (early morning and late afternoon) days.
Q3: How sensitive are the results to the assumed capacity rates? Does the move to a seasonal capacity market have an impact?
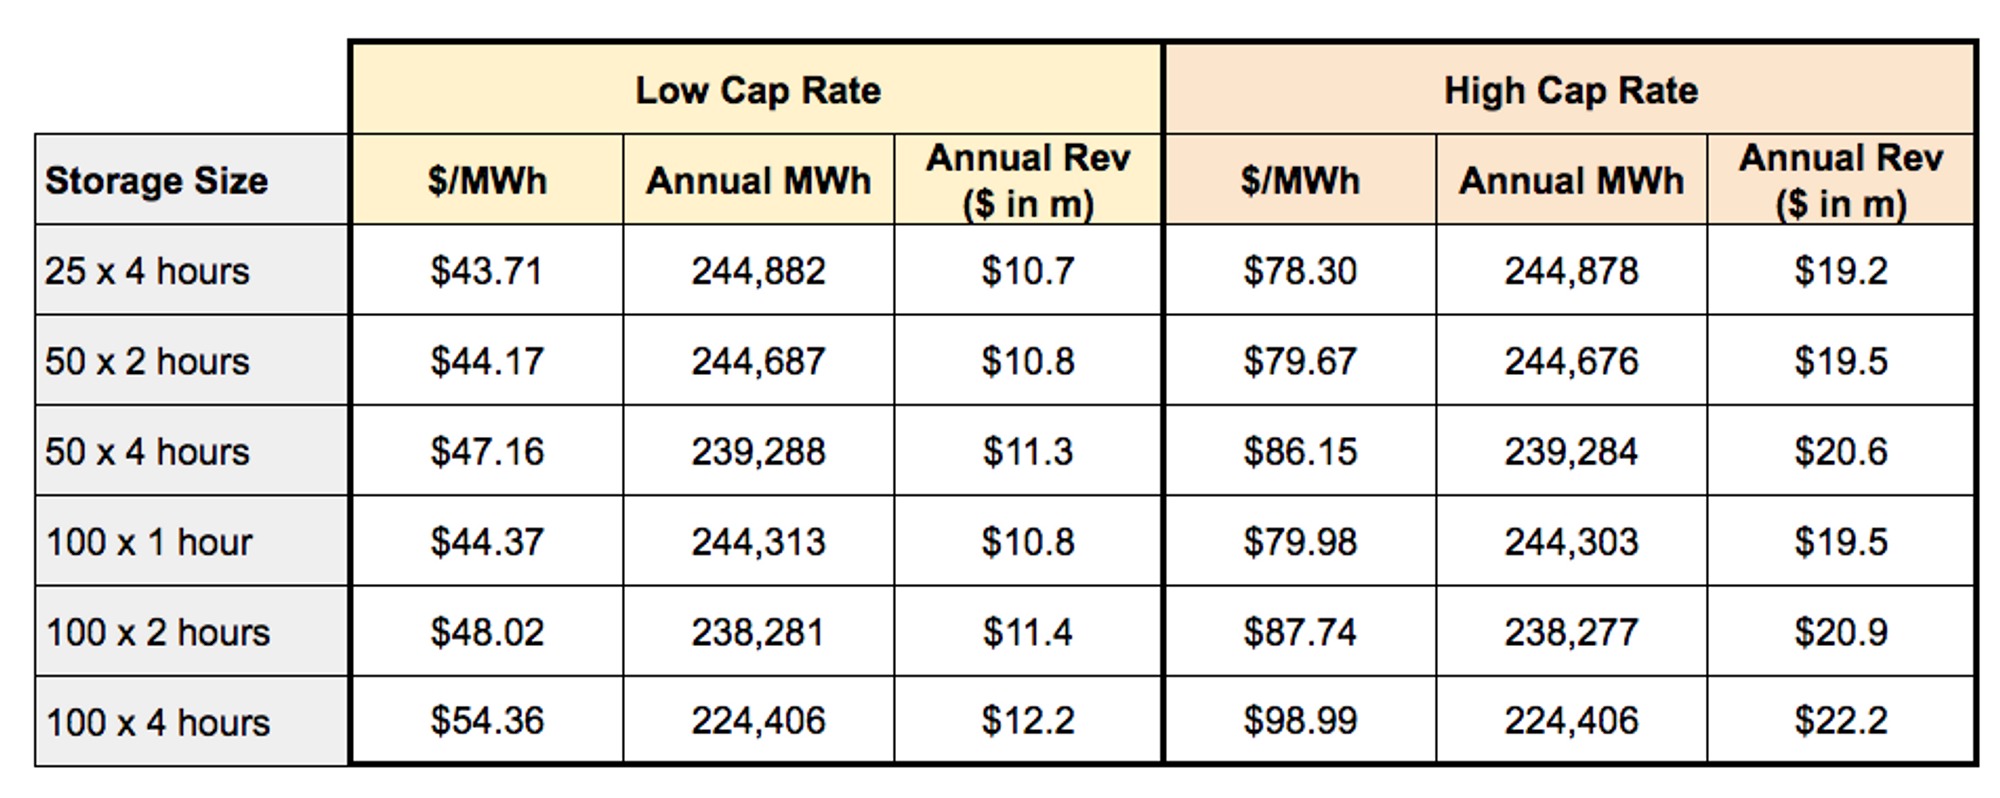
Assumed Capacity Rates
The capacity rates have a substantial impact on expected revenue. The table below details the expected Year 1 production and revenue under the Low and High capacity rate scenarios.
Takeaways:
The higher capacity rates drive the following increase in production-weighted revenue:
- +$35/MWh for the 100 MWh systems
- +$40/MWh for the 200 MWh systems
- +$45/MWh for the 400 MWh system
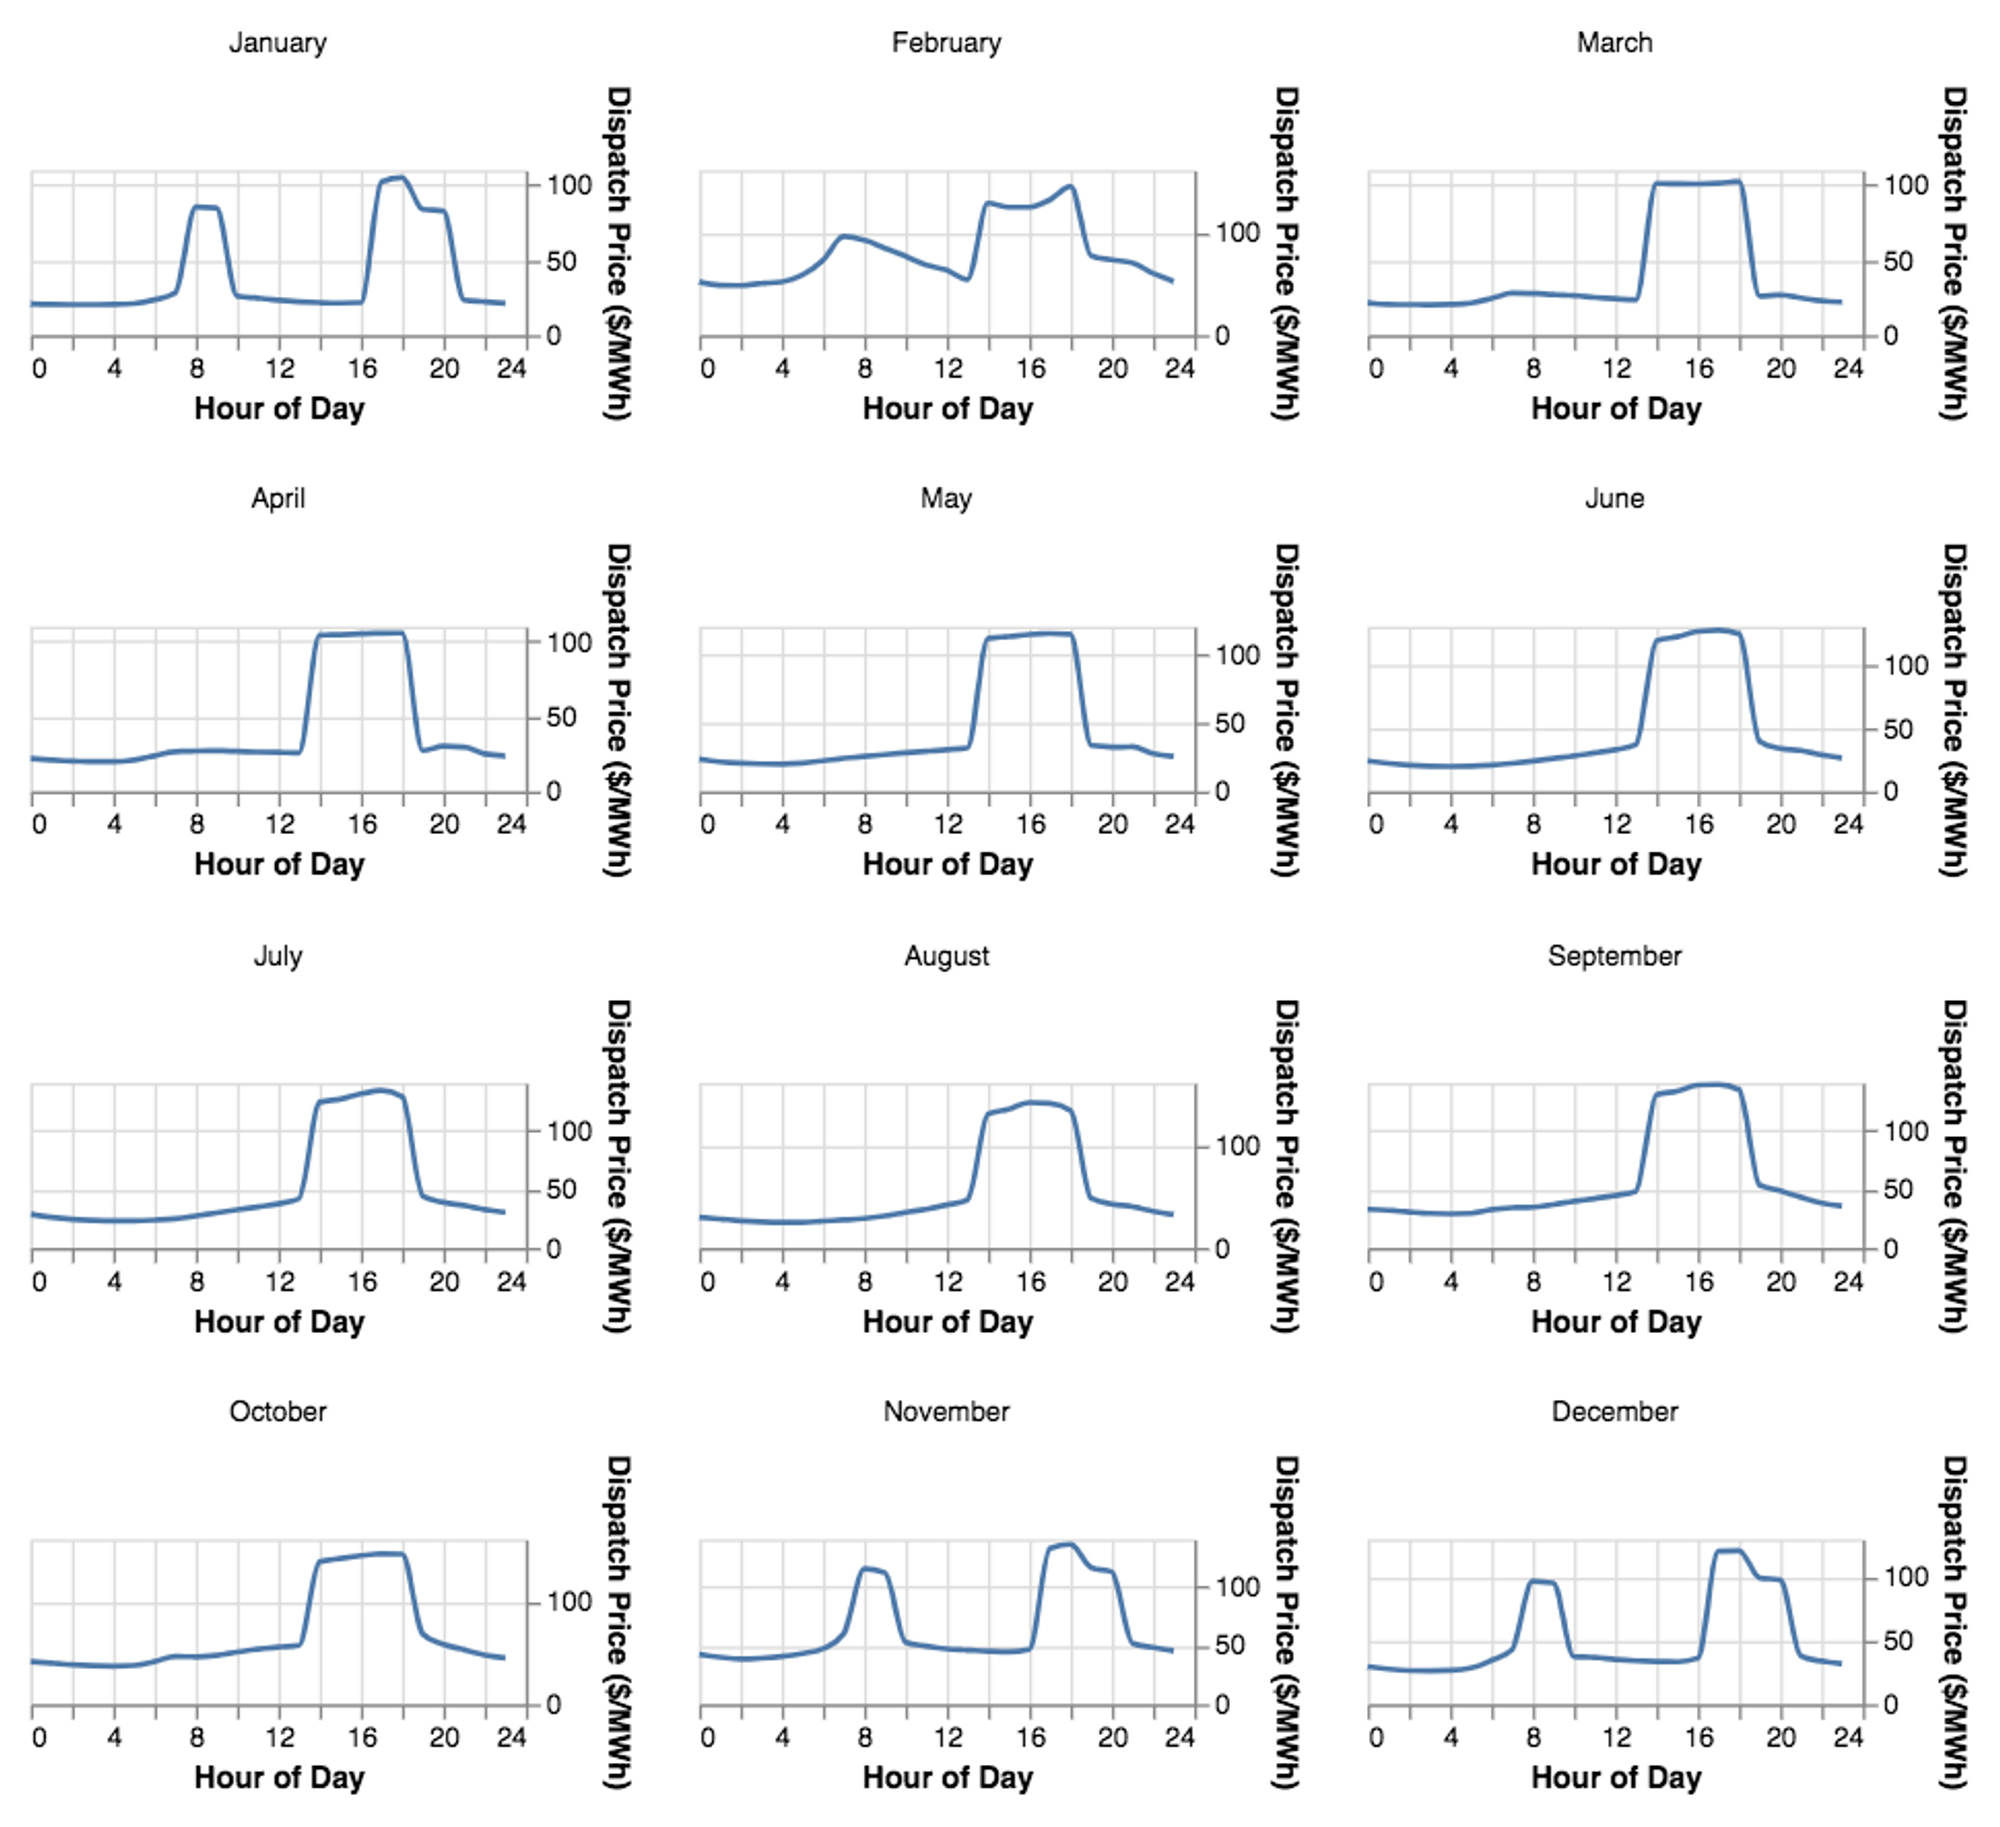
Market Structure Impact
In addition to the capacity rates, MISO is undergoing changes to their capacity market structure, moving from an annual to seasonal auction and a performance-based approach.
- Annual Measurement – Solar capacity (MW) is based on the average solar output from 2-5pm in the summer. Storage capacity (MW) is based on performance during 4 hour system peak periods.
- Seasonal Measurement – Solar capacity (MW) will be based on the average output from 2-5pm in the spring, summer, and fall and from 8-10am and 7-9pm in the winter. Storage capacity (MW) will be based on performance during 4 hour system peak periods each season.
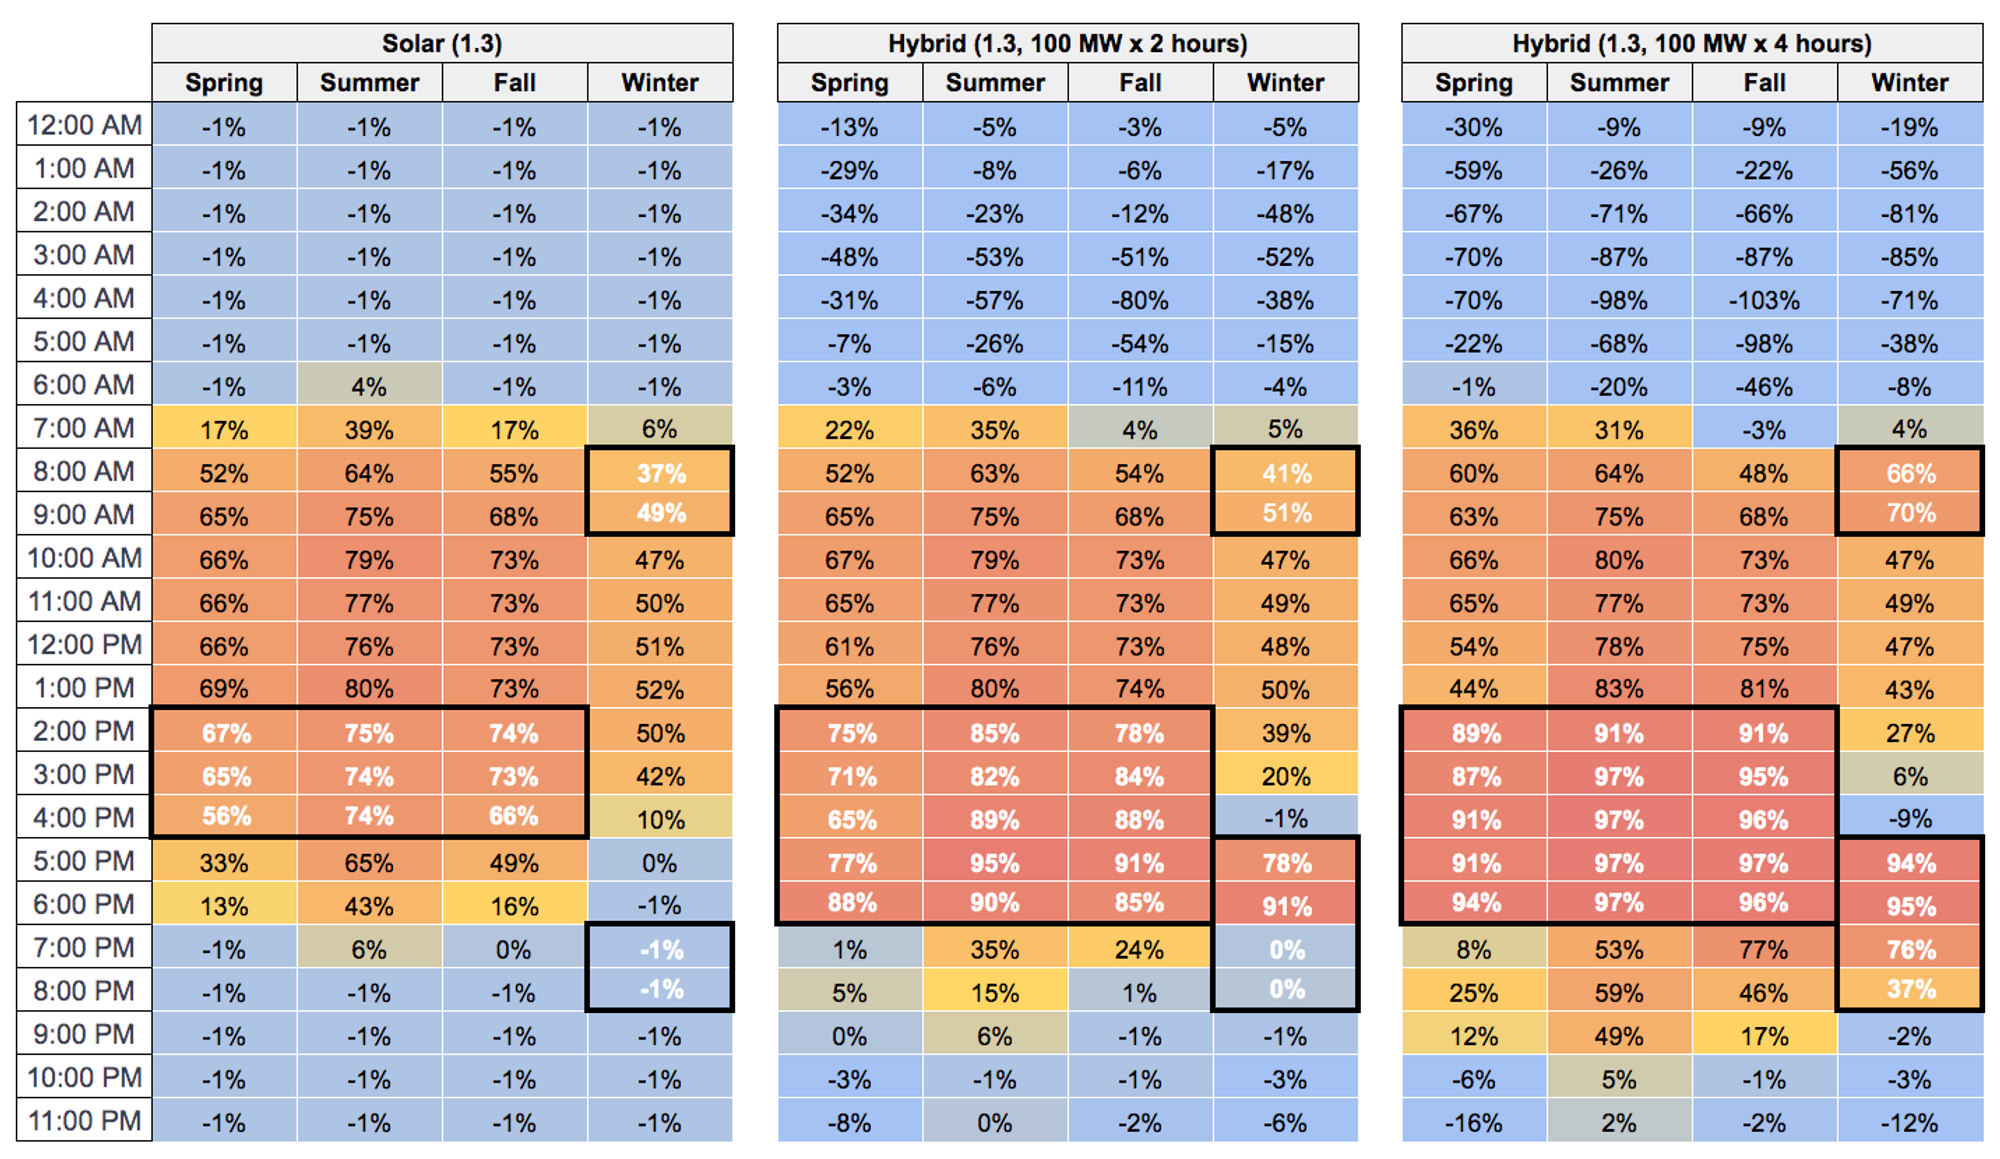
Methodology
To inform how different designs deliver during these peak MISO hours each season, we looked at capacity factor for a:
- Solar-only design
- Hybrid design with 100 MW x 2 hours of storage (200MWh).
- Hybrid design with 100 MW x 4 hours of storage (400MWh).
Takeaways
Solar-only design:
- Current summer measurement: achieves 74% of nameplate.
- Seasonal measurement: drops to 54% of nameplate.
200 MWh hybrid design:
- Current summer measurement: achieves >82% of nameplate.
- Seasonal measurement: drops to >65% of nameplate.
400 MWh hybrid design:
- Current summer measurement: achieves >87% of nameplate.
- Seasonal measurement: drops to >70% of nameplate.
For the hybrid designs, capacity performance could be further improved by allowing more than 1 cycle per day.
Q4: What configurations meet your 6% IRR hurdle?
While we see revenue uplifts from increasing the DC/AC ratio, DC-coupling, and adding energy storage, these design enhancements come with added costs. As such, we need to run each of these scenarios through a financial model to understand which options meet our target hurdle rate. Of the 72 different designs, 33 (or 46%) hit the 6% IRR hurdle under the base CapEx and OpEx assumptions in the financial model.
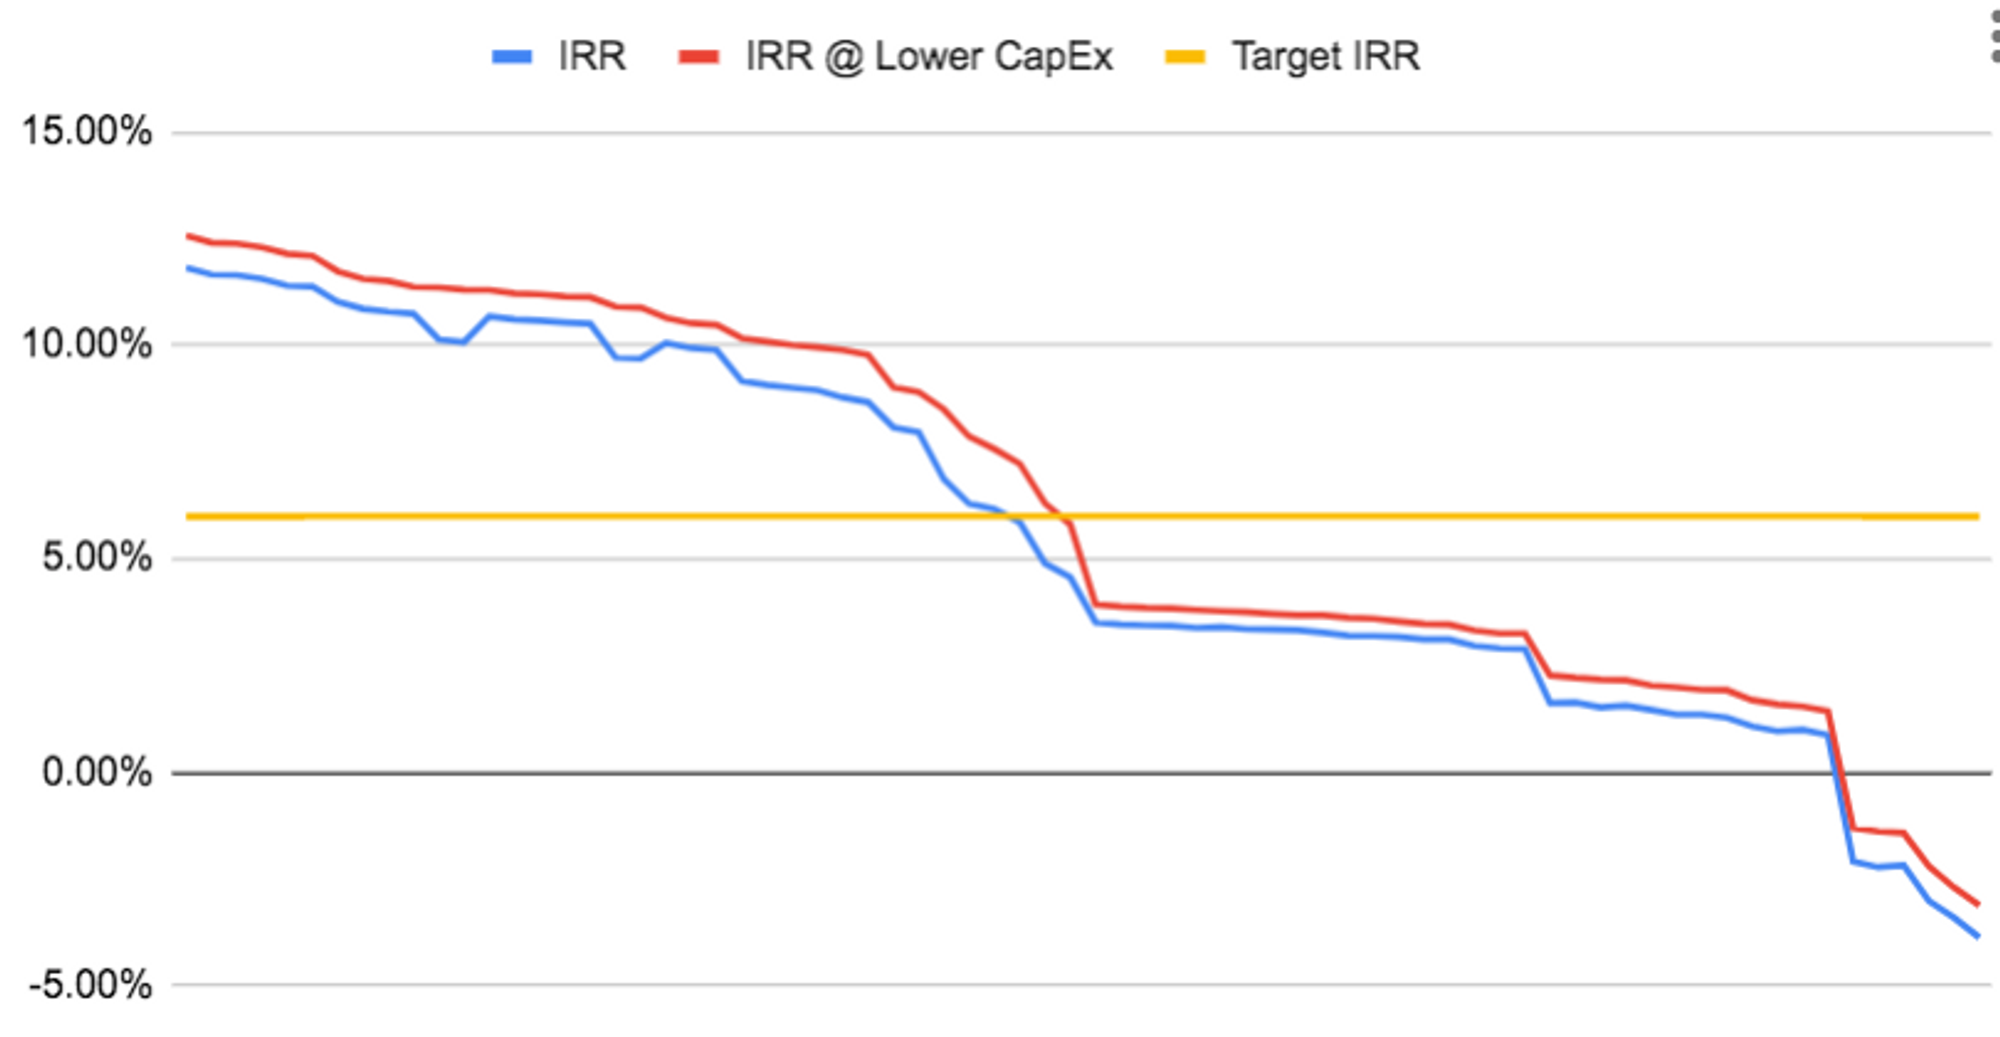
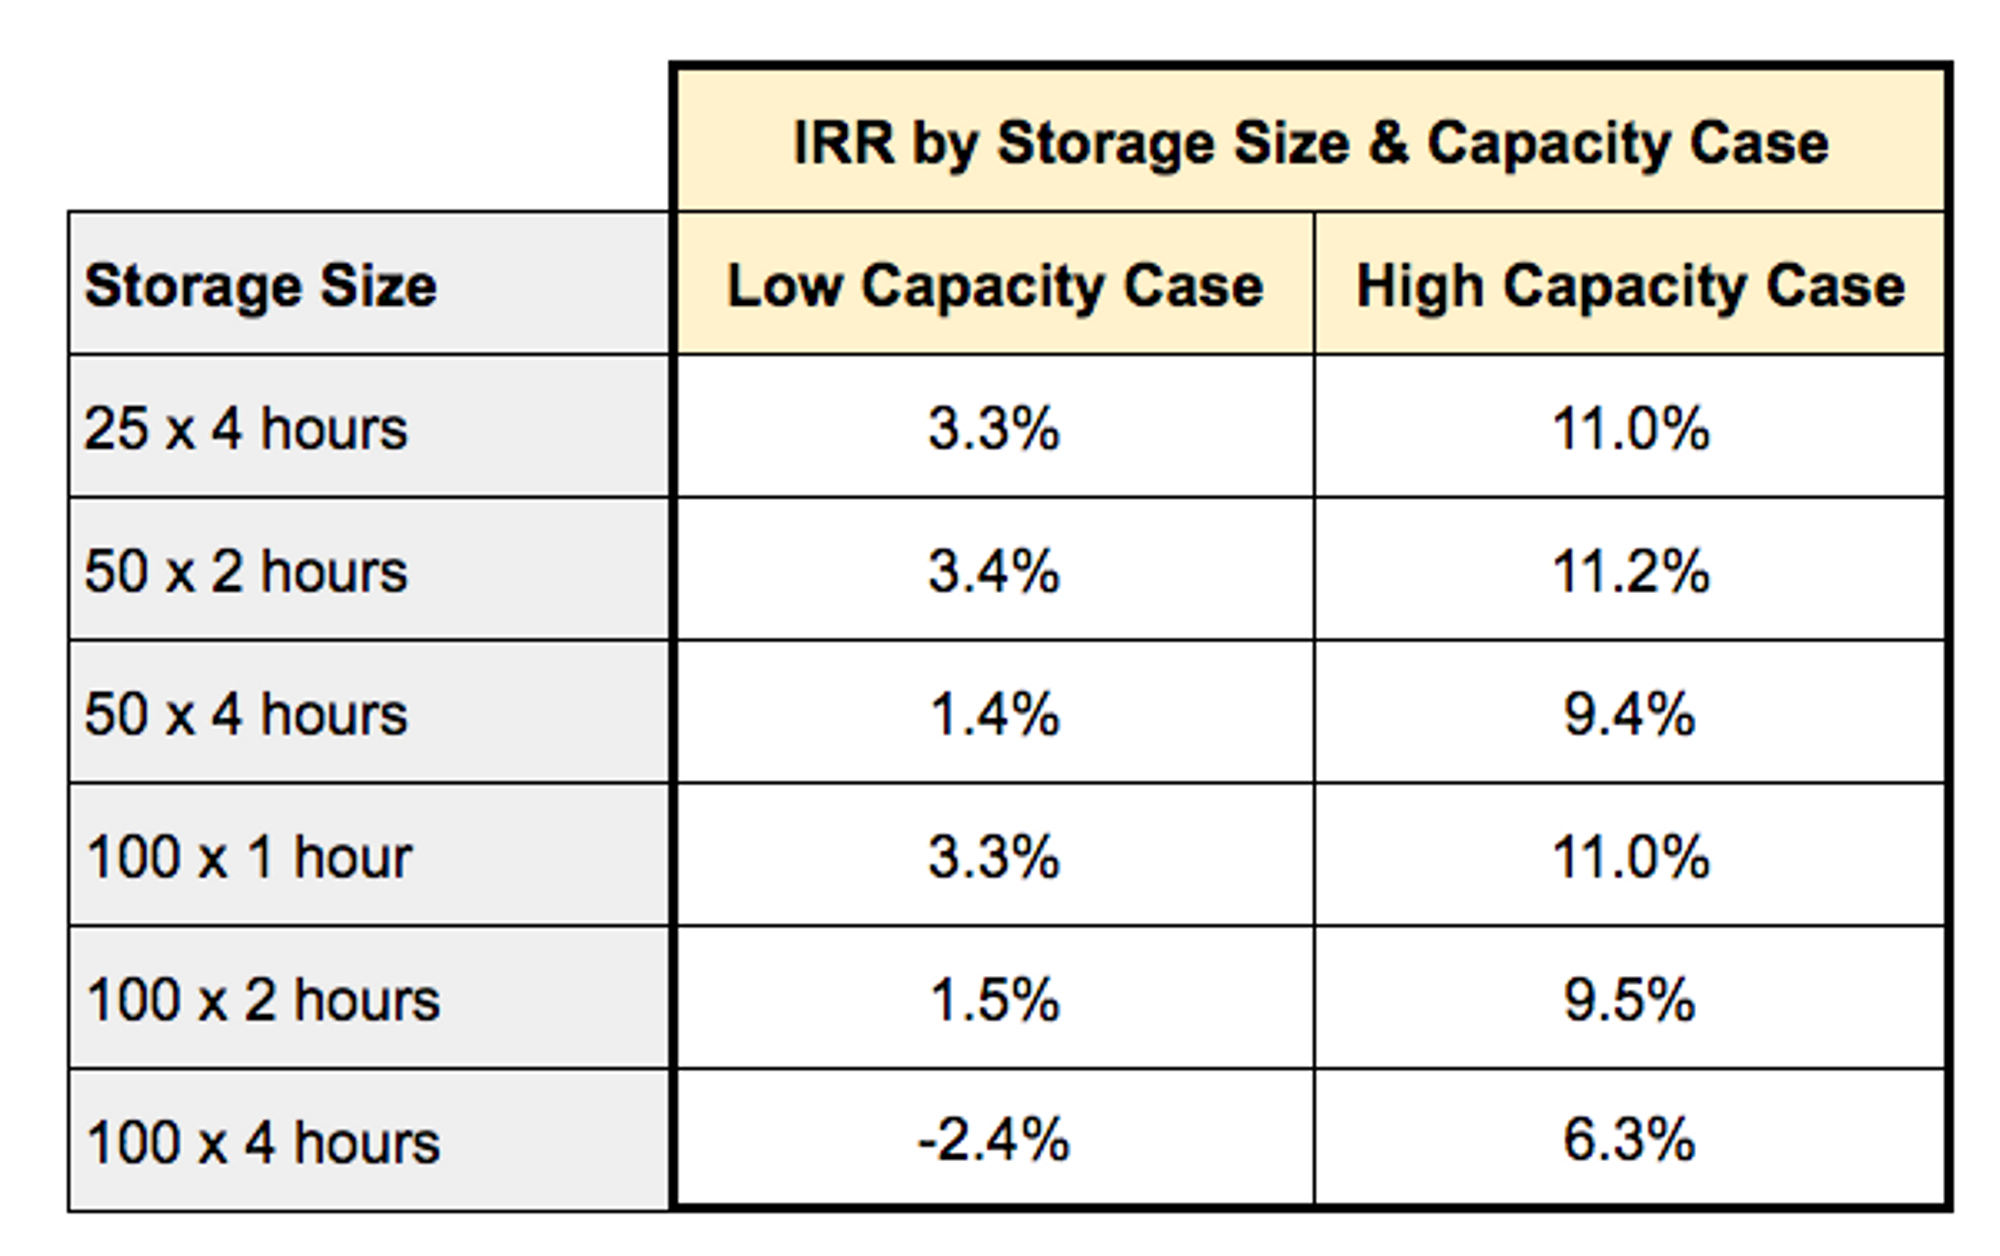
A key driver for hitting the IRR hurdle is the assumed capacity rate. None of the low capacity rate designs hit the 6% target, with most falling in the 2-4% range. Likewise, reducing the storage CapEx by $50 per kWh pulled a couple designs within the target IRR hurdle range.
Key Takeaways
-
- Capacity value key for investment decisions – Of the market assumptions and design tradeoffs considered, the assumed capacity has the highest impact on expected value.
- Grid charging a key enabler – Grid charging provides a meaningful boost (what % gain?), especially as MISO moves to a seasonal capacity market with measurement periods outside prime solar production hours.
- Evolving capacity markets highlight importance of storage – Higher capacity and longer duration storage becomes essential with the switch to a seasonal capacity measurement approach. Because MISO’s generation mix includes more intermittent renewables — solar and wind account for nearly 90% of the 16 GW of generation being added to MISO in 2022 and 2023 — storage provides an additional insurance policy against further capacity market changes.
- Flexible and scalable modeling essential to increasingly complex renewables landscape – You need flexible modeling solutions that can account for the broad range of commercial and technical nuances for any given project.