ERCOT Storage Performance
ERCOT Storage Performance | Winter Storm Fern
Looking back at storage asset operations and performance outcomes from Winter Storm Fern.
Winter Storm Fern arrived exactly as forecast. The scarcity didn’t. For the energy storage operators who read that correctly, it was the best two-day revenue window since RTC+B launched. For most of the battery fleet, it was a missed one.
Cold temperatures, snow, and icy conditions hit Texas January 24-26, 2026. ERCOT issued a Weather Watch and forecast record-breaking winter load peaking on the morning of the 26th. The anticipated scarcity never materialized. At least partially because many schools and businesses didn’t open, suppressing demand in a way that a sharper operator may have been able to foresee.
Winter Storm Fern didn’t disappoint on opportunity. How the fleet responded is a different story.
Revenue overview
The highest earning asset brought in over $22/kW during Winter Storm Fern. The median asset brought in $1.74/kW. The 12x spread between the top earner and the median reflects fundamentally different operating postures and nodal pricing differences that emerged across ERCOT.
The concentration runs deeper than the revenue figures alone. The top 3 earning assets made over 60% of their January revenue on the 25th and 26th. The top earning asset made 98% of its January revenue in those same 2 days. This is a statement about how quickly revenue opportunities in ERCOT can concentrate around a single event, and what it costs to miss one.
Performance overview
The top performing asset captured 177% of its Day-Ahead (DA) TB2 opportunity. The median captured 29%. That’s a 6x performance gap between the best and the middle of the fleet.
High earnings and high efficiency weren’t the same during Winter Storm Fern. The top earning asset brought in $22.19/kW — nearly double the second-highest earner — but only captured 45% of its DA TB2. The second-highest earner captured 177% of its DA TB2, almost 4x the capture rate of the top earner. Two winning strategies that were unified by the operator’s willingness to commit to the Day-Ahead Market (DAM).
Most assets left the majority of available opportunities on the table. Not because the opportunity was hard to see — ERCOT had been forecasting a historic load event for days — but because positioning for it in the DAM required conviction that most of the fleet didn’t bring.
Prices vs. revenue
How the prices landed
DA Energy prices cleared 5–8x higher than Real-Time (RT) Energy prices during parts of Winter Storm Fern.
Through January 24–25, high wind production kept supply elevated and RT Energy and AS prices relatively contained. However, DAM had priced in record winter load forecasts.
Then came 6pm on January 25th. RT Energy prices spiked to ~$700/MWh on average, a real, capturable price event. Most of the storage fleet held off. The reasoning was defensible – higher RT prices were expected on the morning of 1/26, and discharging into the evening spike meant depleting SOC with the risk of high chargeback costs before the following morning forecasted load peak. So they waited.
The morning peak never materialized. Load came in 8–10 GW below initial forecasts, wind overproduced by an additional 2–3 GW, and RT Energy prices on the morning of the 26th settled around $200–300/MW across most of ERCOT.
ERCOT’s tendency to overforecast load during major weather events is a pattern. Every major ERCOT model pointed to an 80–85 GW peak on the morning of Jan 26th. Actual load stayed below 75 GW overnight from the 25th to 26th. Operators who had seen this before (and built some skepticism of consensus load forecasts into their DA strategy) were better positioned to take the DAM bet than those who trusted the models at face value.
How the revenue landed
The DAM ruled, accounting for 81% of total revenue. The split between DA and RT wasn’t close.
The evening of January 25th and morning of the 26th carried essentially all of it. The opportunity concentrated in a 15-hour window.
Day-Ahead Ancillary Services (DA AS) led fleet revenue at 56%. Two products within that bucket deserve their own attention.
- DA Reserves (or RRS) accounted for 27% of fleet revenue — the single largest product contributor. Resources providing RT Reserves serves as one of the final backstops for ERCOT under extreme scarcity events. As such, committing to DA Reserves and then covering that position in RT operations comes with low energy deployment risk, allowing storage resources to maintain high SOC levels. For assets uncertain about committing to full DA Energy positions, DA Reserves positions offered meaningful DAM exposure with lower SOC coverage risk.
- DA ECRS added another 15%. Combined with DA Reserves, those two products accounted for 42% of fleet revenue.
RT Energy came in at just 14% of fleet revenue. Given that RT Energy prices hit ~$700/MWh on the evening of the 25th, that number reflects a fleet that was largely positioned away from the RT market, either by design or by hesitation. The top 20 earners and performers make the distinction explicit. Their RT Energy contribution was ~6% while DAM revenue made up over 90%.

Bidding approaches
To understand what separated the top of the fleet from the rest, let’s go hour by hour.
Worth noting – the strategies that worked during Winter Storm Fern weren’t without exposure. Stacking DA Energy and AS positions at the scale of the top operators (showcased below) creates real delivery and imbalance risk. It paid off this time, but it isn’t a risk-free playbook.
January 25, 2026
How did the highest-performing asset during the storm operate on January 25th?
At this asset’s node, DA Energy carried a persistent premium over RT Energy throughout the entire day — clearing above $1,600/MWh by 10pm. RT Energy followed, but peaked at roughly two-thirds of that.
The asset entered January 25th having committed its full power capacity into DAM positions for Energy, Non-Spin, Reserves, and ECRS across almost the entire day. This included multiple periods of stacked DA Energy positions which would have been infeasible to cover in RT operations given its ~2 hour duration. Pairing that many DAM obligations across consecutive hours creates real RT exposure if RT Energy and AS prices come in higher than DA.
DA Energy bids were placed during crucial hours, 6–8pm and 9–11pm, where the premium was expected to concentrate. Revenue built steadily from the first hour and accelerated into the evening as the DA premium held. The resource had minimal dispatch across the day, maintaining a high SOC and capturing DART spreads across its Energy and AS positions. By midnight, the asset had earned $3.52/kW — almost entirely from positions locked in the previous day.
How did the highest-earning asset during the storm operate on January 25th?
At this asset’s node, the picture was more complicated. The DART premium wasn’t persistent. RT Energy prices actually ran higher than DA during three hours of the evening, making the product decision genuinely difficult.
The operator made DAM commitments across DA Energy, Reserves, and ECRS — but at a smaller scale than the top performer, committing to DA Energy across fewer hours and a smaller % of its power capacity. The idea was to balance some DAM exposure, while preserving SOC and flexibility to go after RT opportunities if they emerged.
The evening DA Energy positioning didn’t land as cleanly as the top performer. The DART spread flipped during the 8-9pm window — the exact hour the operator had committed to DA Energy. The operator largely covered its DA Energy position and was also able to supplement with additional RT Energy dispatch. The result was $1.48/kW earned by midnight.
It’s not a failure, it’s a different node with a genuinely trickier DART structure. But stacked against the high performer’s $3.52/kW on the same day, it illustrates how much the market rewarded operators who committed fully to the DAM when the DA premium was clear and persistent. At nodes where it wasn’t, the call was harder, and the margin for error smaller.
January 26, 2026
On the 25th, two operators experienced different DART spreads and made different calls. The 26th reset the board. A very large DA Energy spike hit in the morning across nodes.
How did the highest-performing asset during the storm operate on January 26th?
At this operator’s node, DART spreads were upward of $1,600/MWh in the morning hours. The operator came in fully committed. DAM positions across DA Energy, Non-Spin, Reserves, and ECRS, with DA Energy positions across the 6–10am window to align with the anticipated morning spike.
That was a conviction call. Concentrating in DA Energy exposure across 4 consecutive hours meant full commitment in the direction of DA vs. RT Energy prices — and against ERCOT load forecasts that, as history shows, tend to run high during major weather events.
It paid off. The asset captured $8.23/kW across the day, with roughly 70% of that earned in just four morning hours. After 10am, prices flattened out and the storm’s opportunity had already been captured.
How did the highest-earning asset during the storm operate on January 26th?
This asset’s node saw DART spreads upward of $20,000/MWh — extreme conditions driven by scarcity pricing and highly favorable nodal position. The operator had committed to DAM, with DA Energy, ECRS, and Reserves positions stacked from midnight through 10am.
It resulted in $20.51/kW of revenue in a single day with 85% of that earned across four morning hours.
Viewed across both days, the contrast sharpens. The high-performing asset had more consistent nodal conditions — a persistent DA premium on the 25th and a strong morning spike on the 26th. The high-earning asset navigated a trickier 1/25, earned less that day, but was positioned at a node with extraordinary spreads on the 26th.
What looked like clean wins in hindsight was a leveraged position going in. The stacking of DAM obligations across Energy and AS products created real operational exposure on both days — it paid off during Winter Storm Fern, but the same approach in a different market outcome could have left operators facing significant RT exposure costs they weren’t positioned to cover.
What this means for the next storm
Winter Storm Fern surfaces three questions worth sitting with before the next weather event.
- How much are you anchoring to the ERCOT forecast? Since Winter Storm Uri, ERCOT has had a tendency to overforecast load during extreme weather events. Throughout the 25th and into the morning of the 26th, ERCOT’s load forecast models pointed to an 80–85 GW peak on the morning of 1/26. Actual load peaked that morning at ~75GW. Operators who build some forecast skepticism into their operating strategies (rather than anchoring to consensus models) have a structural edge in events like this. That edge is learnable.
- Are you positioned for the DAM? With scarcity conditions never materializing, betting big on DA Energy and AS was a winning strategy. The top 20 earners and performers had over 90% of revenue come from DAM.
- However, the harder question is risk calibration. How much DAM exposure is the right amount during an extreme weather event? For example, the top performing asset referenced above took on DA Energy positions that it would not have been able to cover in RT operations – exposing it to RT imbalance costs if RT Energy prices spike above DA. The operators who won had conviction in DAM. But conviction without a risk framework isn’t a strategy. It’s a riskier bet.
*Top earners defined as highest $/kW
**Top performers defined as highest percent of DA TB2 captured
-
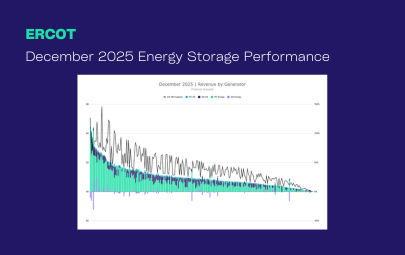
ERCOT Storage Performance
December 2025 Performance | ERCOT
03/20/26
-
Case Studies
Capturing ERCOT’s first post-RTC+B price spike
12/22/25
-
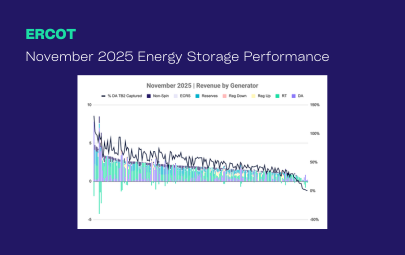
ERCOT Storage Performance
November 2025 Performance | ERCOT
02/18/26
-
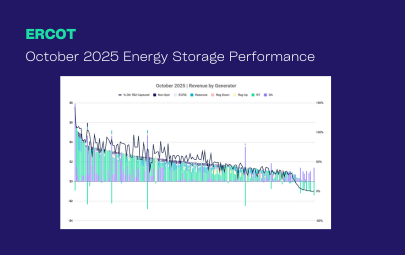
ERCOT Storage Performance
October 2025 Performance | ERCOT
01/14/26
-
ERCOT Storage Performance
Q3 2025 Performance | ERCOT
12/16/25
-
ERCOT Storage Performance
September 2025 Performance | ERCOT
12/15/25
-
ERCOT Storage Performance
August 2025 Performance | ERCOT
11/19/25
-
ERCOT Storage Performance
July 2025 Performance | ERCOT
10/15/25
-
ERCOT Storage Performance
H1 2025 Performance | ERCOT
09/16/25
-
ERCOT Storage Performance
June 2025 Performance | ERCOT
09/16/25
-
ERCOT Storage Performance
May 2025 Performance | ERCOT
08/12/25
-
ERCOT Storage Performance
April 2025 Performance | ERCOT
07/15/25
-
ERCOT Storage Performance
Q1 2025 Performance | ERCOT
06/26/25
-
ERCOT Storage Performance
March 2025 Performance | ERCOT
06/17/25
-
ERCOT Storage Performance
February 2025 Performance | ERCOT
05/13/25
-
ERCOT Storage Performance
January 2025 Performance | ERCOT
04/28/25
-
ERCOT Storage Performance
2024 Storage Performance | ERCOT
04/09/25
-

Guides
Benchmarking Energy Storage Performance in ERCOT: What Good Looks Like
02/24/25