ERCOT Storage Performance
ERCOT Storage Performance | November 2025
Looking back at storage asset operations and performance outcomes from November 2025.
November marks the last full operating month before RTC+B launched in ERCOT, and both fleet revenue and performance softened slightly month-over-month. The top earners were responsible for much of this decrease. Only three operators exceeded 100% Day-Ahead TB2 capture in November, down from eight in October. The very top earners also saw revenue decrease meaningfully, with $/kW revenue down more than 15% for the top two, and down 13% on average across the top 10.
Revenue outcomes
Across the fleet, revenue was split almost equally between Day-Ahead (DA) and Real-Time (RT) energy. Though, DA energy showed a premium to RT energy in 63% of peak hours. Compared to the fleet, the top 20 earners leaned into DA energy more aggressively, which implies they were more confident in where the premium would land. Together, this data tells us that much of the fleet missed out on upside opportunity by not committing more consistently to DA energy.
- Highest earning asset made $5.91/kW, while the top 50 revenue generators averaged $3.13/kW
- Median asset brought in $1.94/kW, with the fleet average slightly higher at $2.00/kW
- Energy made up the majority (63%) with an almost even split in DA and RT energy
The top earners’ operating strategies varied, but the majority took two different operating approaches. Some of the operators pushed hard into DA energy and even took losses in RT energy to support the approach. The rest ran similar profiles, with revenue split between RT energy and Ancillary Services (AS).
Revenue composition breakdown
The top earners and performers (measured by DA TB2 capture) generated the majority of revenue in DA energy, followed by AS. Top performers leaned even further into the DAM with RT energy making up just 14% of revenue. That pattern lines up with the month’s pricing. DA energy carried a premium to RT in 63% of peak hours, so the best results came from operators who could consistently bet on the DA premium. From there, results came either from capturing the DART spread without discharging, or from managing state-of-charge (SOC) to deliver and earn the full DA energy price. This also mirrors the premium we have continued to see post-RTC+B.
Asset performance
As mentioned earlier, fewer operators captured over 100% DA their TB2 compared to previous months. With more revenue opportunities concentrated in DA energy, the DA TB2 benchmark rose, which made it harder for assets that stayed more RT energy-leaning to clear that bar. Committing to the DAM carries higher risk, but in November, taking that risk was the best path to top performance.
The top 6 performers also ranked among top 8 earners, so the same two operating approaches show at the top. Half of the assets went all in on DA energy vs. the other half balanced RT energy and AS (mainly Reserves). In a calmer month like November, batteries may be more likely to bid into Reserves since the opportunity cost of chasing RT energy spikes is typically lower. Taking a look at their DA and RT TB2 values, the gap across these assets was under $1/kW, which suggests neither product consistently dominated. In that context, the split strategies are a reminder there is not one “right” product mix. Operators must stay flexible and tune their strategy to daily conditions and nodal dynamics.
- Top performing asset captured 131% of its DA TB2 opportunity, and the top 50 averaged 77%
- Median asset captured 51%, with the fleet average coming in similarly at 52%
Asset performance by duration
Breaking down each asset by duration, the DA energy theme continues. Those that wanted to do well leaned away from RT energy. As duration increased, DA energy revenue followed – besides shorter duration assets, which mainly stuck with AS.
Breakdown by asset duration:
- Short duration assets (<1.1 hours) stayed light on DA energy and relied more on AS, consistent with previous months. Their revenue mix points to a strategy of earning capacity payments with low likelihood of having to expend energy.
- Mid-duration assets (1.1–1.6 hours) made the majority in energy, but AS played a significant role, making up 43% of revenue. The top 10 had a similar revenue mix, but leaned slightly more into DA energy, which makes sense given the DA energy premium.
- Long duration assets (>1.6 hours), similar to the top performers across the fleet, DA energy made up the majority. Zooming into the top 10, DA energy’s share increases further while RT energy’s role shrinks. Compared to shorter-duration assets, long duration assets can commit more comfortably in the DAM because they have more stored energy to work with, which lowers the opportunity cost of leaning into DA energy.

Interesting day deep dive
November 7th was the most lucrative day for the storage fleet. Fleet revenue was split between RT and DA energy, and both markets saw elevated prices over the course of a five hour evening peak. With the peak stretched over multiple hours – and across both energy products – the elevated prices were extremely capturable for most storage assets.
November 7, 2025
The day had a normal price shape until 4pm. From 4-9pm, energy prices were above $100/MWh.
- 4-7pm: DA > RT ($94 premium)
- 7-8pm: DA < RT ($59 premium)
- 8-9pm: DA > RT ($40 premium)
This 5-hour stretch of elevated prices gave operators plenty of runway. With the longer peak, there was less risk of discharging too early (or too late), and since both DA and RT energy prices were strong, there was less penalty for being in the “wrong” product. Operators may have missed out on a few $/MWh, but would still capture relatively high prints either way.
How did a high earning asset operate on November 7th?
The top earner, located in the West Load Zone, captured the evening peak perfectly. The operator though has an advantage as the asset is a 4-hour duration asset, while the rest of the ERCOT fleet is in the 1-2 hour duration range. This longer duration unlocked the ability to take aggressive positions across the evening peak, capturing much more revenue relative to 1-2 hour assets.
Prior to the November 7th operating day, the operator cleared positions in DA energy across 10am-1pm and 4-7pm.
In the morning of November 7th, the operator discharged into RT energy. Midday, RT energy prices were lower than DA energy. The operator captured a small DART spread, choosing not to deliver on their DA energy obligations and instead charge to gain SOC so they were able to deliver their evening obligations. From 4-7pm, the asset discharged perfectly into the evening peak, fully covering its DA energy position and capturing the $251/MWh DA energy prices. From 7-8pm, the operator caught the premium again by discharging their remaining capacity into RT energy. This netted the operator $0.72/kW on the day.
*Top earners defined as highest $/kW
**Top performers defined as highest percent of DA TB2 captured
-
ERCOT Storage Performance
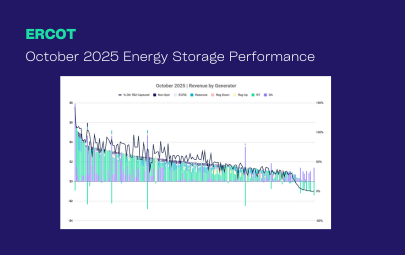
October 2025 Performance | ERCOT
01/14/26
-
ERCOT Storage Performance
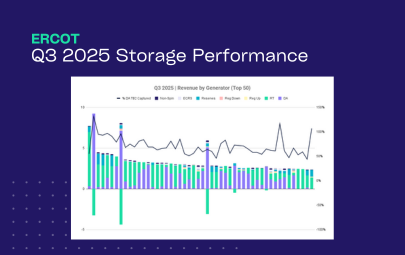
Q3 2025 Performance | ERCOT
12/16/25
-
ERCOT Storage Performance
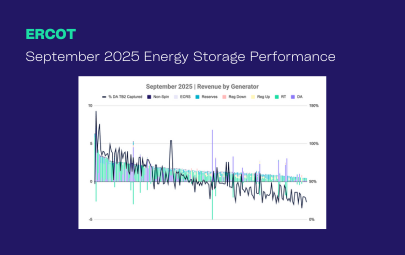
September 2025 Performance | ERCOT
12/15/25
-
ERCOT Storage Performance
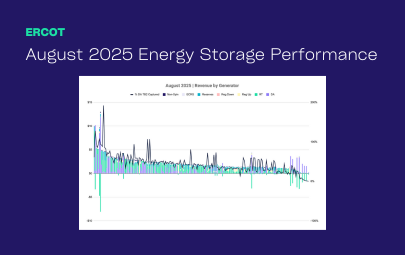
August 2025 Performance | ERCOT
11/19/25
-
ERCOT Storage Performance
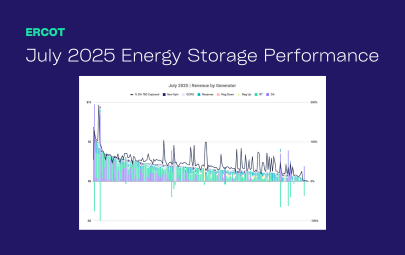
July 2025 Performance | ERCOT
10/15/25
-
ERCOT Storage Performance
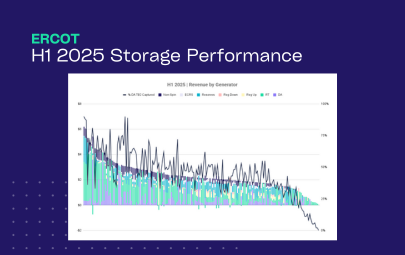
H1 2025 Performance | ERCOT
09/16/25
-
ERCOT Storage Performance
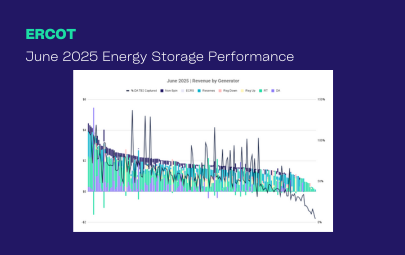
June 2025 Performance | ERCOT
09/16/25
-
ERCOT Storage Performance
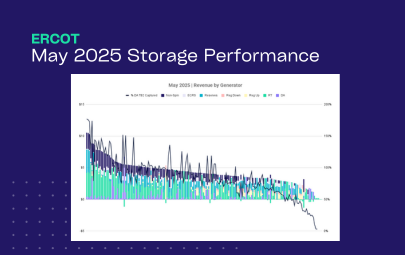
May 2025 Performance | ERCOT
08/12/25
-
ERCOT Storage Performance
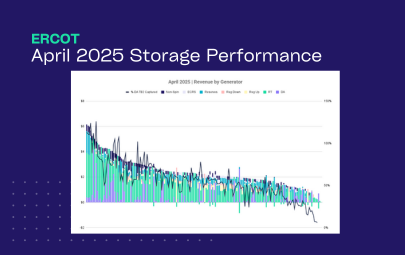
April 2025 Performance | ERCOT
07/15/25
-
ERCOT Storage Performance
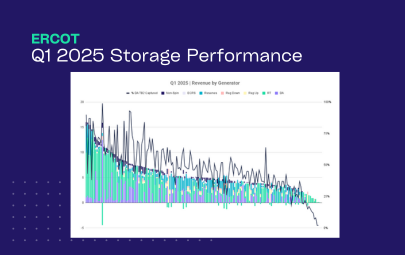
Q1 2025 Performance | ERCOT
06/26/25
-
ERCOT Storage Performance
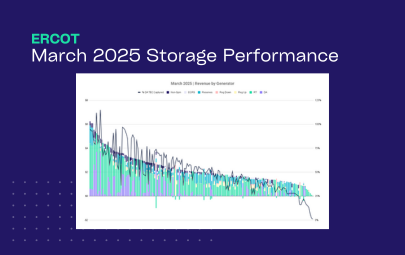
March 2025 Performance | ERCOT
06/17/25
-
ERCOT Storage Performance
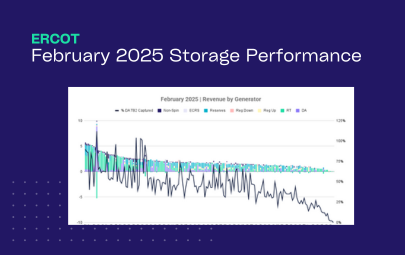
February 2025 Performance | ERCOT
05/13/25
-
ERCOT Storage Performance
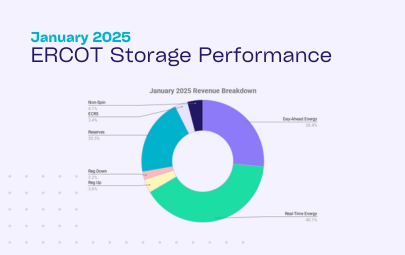
January 2025 Performance | ERCOT
04/28/25
-
ERCOT Storage Performance
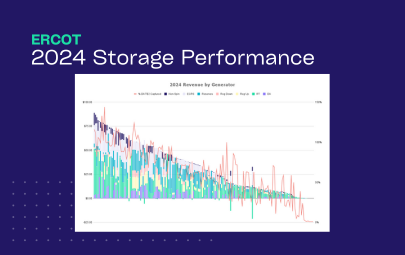
2024 Storage Performance | ERCOT
04/09/25
-

Guides
Benchmarking Energy Storage Performance in ERCOT: What Good Looks Like
02/24/25