ERCOT Storage Performance
ERCOT Storage Performance | September 2025
Looking back at storage asset operations and performance outcomes from September 2025.
September officially marked the transition into shoulder season in ERCOT — and the revenue numbers reflect it. As volatility softened, nearly every asset across the fleet felt the impact.
At the same time, the month reinforced several important operational themes that will only become more relevant under RTC+B – in a changing market, off-the-shelf operating strategies don’t cut it, and real-time agility and proactive optimization is critical to top performance.
Revenue outcomes
Average fleet revenue was down ~20% compared to August – and 27% for the top 20 revenue generators. Essentially, all assets made less, and there were fewer energy storage resources (ESRs) that significantly out-earned their peers.
- Highest earning asset made $6.34/kW, while the top 50 revenue generators averaged $2.76/kW
- Median asset brought in $1.44/kW, with the fleet average slightly higher at $1.66/kW
- Real-Time (RT) energy made up the majority of revenue at 44%, reclaiming its lead after an anomaly in August where DA energy comprised the majority of revenue.
Looking at the revenue mix, RT energy made up the majority of revenue at 44%, and climbed to 59% for top earners and 56% for top performers, underscoring its strategic value this month.
On the flip side, Ancillary Services (AS) accounted for an even smaller portion of revenue across the board. AS continues to show signs of structural saturation — a trend we’ve observed throughout the year. With RTC+B officially live, early data suggests new AS revenue opportunities may emerge in real time, but it will take weeks/months for prices to normalize.
What is already clear is that real-time agility is becoming the primary performance lever, a dynamic that will only intensify with five new AS products now trading in RT.
Asset performance
While revenue was down in September, performance, measured by percent of DA TB2 captured, improved month-over-month. With less volatility, energy price shapes become more predictable and price spreads are therefore easier to capture.
Furthermore, in peak hours DA and RT energy each cleared higher ~50% of the time. This gestures towards the same notion – it was harder for an operator to go very wrong in their strategy.
- Top performing asset captured 143% of its DA TB2 opportunity, and the top 50 averaged 85%
- Median asset captured 49%, with the fleet average coming in similarly at 55%
One other interesting dynamic from September was found at the very top of the leaderboard. The highest-revenue asset had the largest DA TB2 and RT TB2 opportunity in the entire fleet — but captured less than the median in both.
They were unable to convert their large opportunity into proportional revenue. It’s a clean example of how nodal conditions alone don’t guarantee top performance — execution still reigns.
Looking specifically at September’s top-performing assets, we see revenue composition split into two camps:
- DA energy dominant: the top two performers made almost 100% of revenue in DA energy – and a cluster of ESRs ranked around 20th-30th also leaned primarily on DA energy, with some RT energy or AS revenue to supplement.
- RT energy dominant: the rest of the top 50 performers brought in almost all revenue from RT energy, with some AS participation layered in.
Given that DA and RT energy were nearly evenly split in terms of peak-hour price leadership in September, this makes intuitive sense. Either approach could work — and neither consistently ran away with outsized results.
Asset performance by duration
Assets of different durations took noticeably different approaches to achieving top performance in September. Across all duration groups, energy made up the majority of revenue — but how assets accessed that energy revenue varied.
One of the biggest shifts: Short-duration assets (<1.1 hours) leaned far more heavily into RT energy than in prior months.
Historically, shorter-duration assets have relied more on AS to remain competitive. In September, that changed:
- Short-duration assets (<1.1 hours) shifted away from AS and toward RT energy as their primary revenue driver
- Mid-duration assets (1.1–1.6 hours) leaned heavily on DA energy
- Longer-duration assets (>1.6 hours) went all in on energy, with RT energy comprising the majority
AS opportunity has likely become too saturated to reliably support even short-duration assets on its own. As a result, these assets were forced to become more active in energy — and particularly focused on RT energy, likely due to the lower risk profile.
This shift is reinforced by stark differences between the revenue composition of the shorter duration fleet overall versus the top 10 performers with assets in this duration group. The top performers made far greater use of RT energy, and in September, that shift clearly paid off.
Meanwhile, longer-duration assets remain structurally advantaged in energy. A two hour asset has twice as many shots on goal as a one hour battery – so they are twice as likely to hit a peak and capture high price prints.

Interesting day deep dive
In a month defined by low volatility, fleet revenue exceeded $0.10/kW on only two days. The most lucrative of those was September 23rd, when fleet-wide revenue peaked at $0.12/kW.
September 23, 2025
In keeping with the theme of the month, September 23rd represented a day with a fairly normal price shape – and some RT energy revenue opportunity.
Prices were modest in the morning, dipped into the negatives during midday, then RT energy prices started to rise at 7pm, and reached $194/MWh at 8pm, the highest price of the day.
How did a high performing asset operate on September 23rd?
Execution on September 23rd was a textbook example of simple, disciplined real-time operations:
- The operator charged midday during negative prices, effectively getting paid to prepare for the evening peak
- The asset then discharged from 7–9pm into the RT price spike
- As a 2-hour asset, this battery was able to capture both hours of elevated prices and end the day at $0.39/kW
The operator took a simple approach and, in this instance, it paid off.
*Top earners defined as highest $/kW
**Top performers defined as highest percent of DA TB2 captured
-
ERCOT Storage Performance
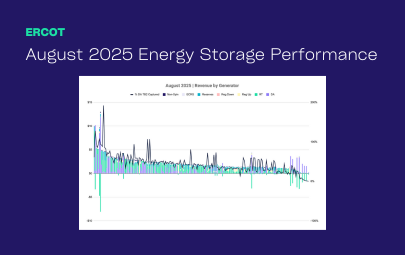
August 2025 Performance | ERCOT
11/19/25
-
ERCOT Storage Performance
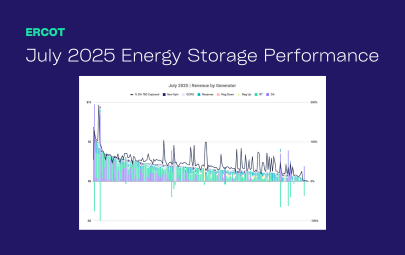
July 2025 Performance | ERCOT
10/15/25
-
ERCOT Storage Performance
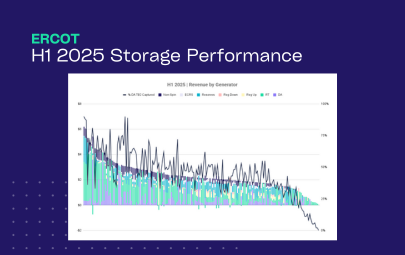
H1 2025 Performance | ERCOT
09/16/25
-
ERCOT Storage Performance
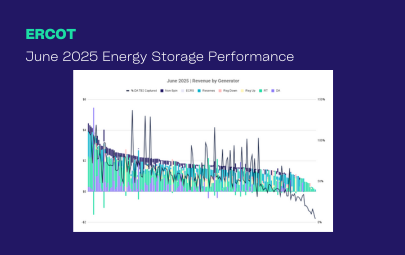
June 2025 Performance | ERCOT
09/16/25
-
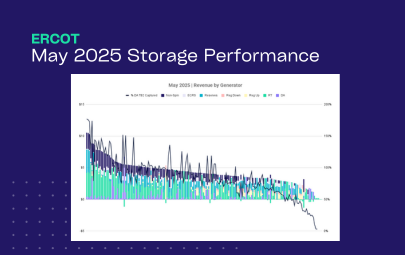
ERCOT Storage Performance
May 2025 Performance | ERCOT
08/12/25
-
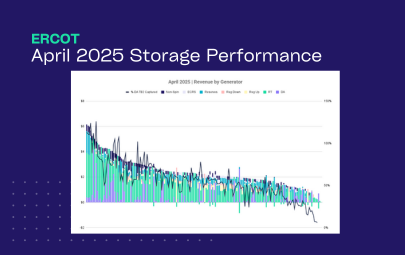
ERCOT Storage Performance
April 2025 Performance | ERCOT
07/15/25
-
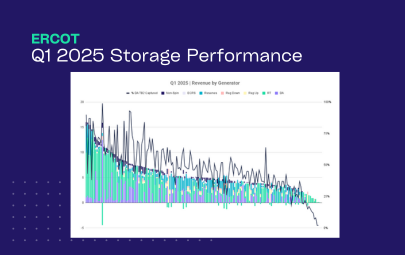
ERCOT Storage Performance
Q1 2025 Performance | ERCOT
06/26/25
-
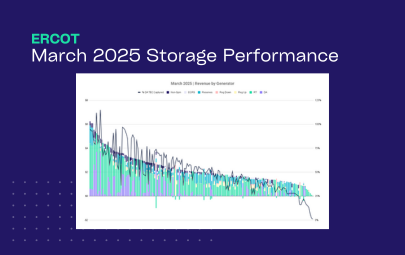
ERCOT Storage Performance
March 2025 Performance | ERCOT
06/17/25
-
ERCOT Storage Performance
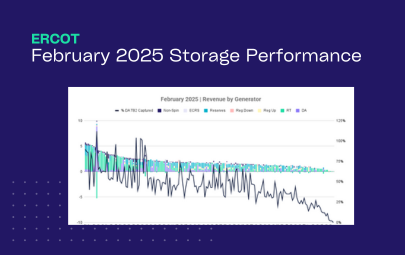
February 2025 Performance | ERCOT
05/13/25
-
ERCOT Storage Performance
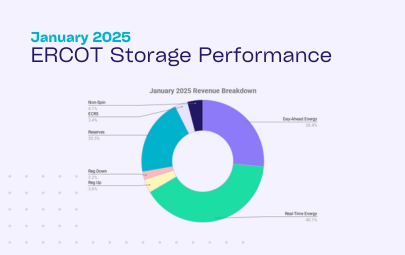
January 2025 Performance | ERCOT
04/28/25
-
ERCOT Storage Performance
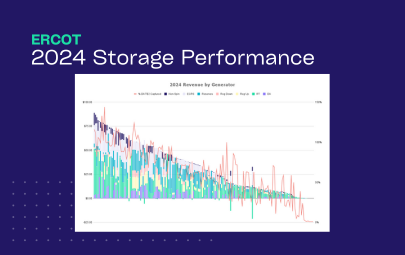
2024 Storage Performance | ERCOT
04/09/25
-

Guides
Benchmarking Energy Storage Performance in ERCOT: What Good Looks Like
02/24/25