ERCOT Storage Performance
ERCOT Storage Performance | H1 2025
Looking back at storage asset operations and performance outcomes throughout H1 2025.
H1 2025 proved to be a fairly low revenue opportunity period for energy storage systems in ERCOT. Volatility was low and with few high-price intervals, opportunities to capture large margins were limited.
Despite 4344 total hourly intervals:
- Average Day-Ahead (DA) energy prices across nodes only exceeded $500/MWh in 4 intervals, and $200/MWh in 15 intervals on average
- Average Real-Time (RT) energy prices across nodes only exceeded $500/MWh in 3 intervals, and $200/MWh in 19 intervals on average
Furthermore, 42% of all fleet revenue was made in Ancillary Services (AS). While dynamics varied by node, the majority of operators had to rely on more balanced, dynamic approaches to capture value. Real-time energy price spikes were no longer able to provide the balance-sheet carrying returns.
The lower volatility is largely attributable to batteries. With over 14GW on the grid – they are doing their job of stabilizing the grid, delivering reliable energy when it is needed, and they are doing it well. But this does mean that in order to achieve revenue and performance outcomes, more strategic planning, real-time agility, and consistent optimization is required.
Let’s dive into how the fleet performed.
Revenue outcomes
Revenue in H1 2025 was lower than most operators likely hoped given the muted volatility — though some assets still managed to post strong outcomes.
- Top revenue generator net $6.19/kW-month and captured 112% of its DA TB2
- Top 20 assets averaged $4.63/kW-month, and captured an average of 85% of their DA TB2
- Median asset came in at $2.13/kW-month
Revenue opportunity leaned slightly toward the real-time market (RTM), with average RT TB2 at $30.16 compared to $23.91 in DA. However, DA energy actually cleared higher than RT in 62%, and over 65% of all peak hours, reinforcing the importance of layering both markets into a balanced strategy.
Top revenue generators relied heavily on RT energy, supplementing a bit with Reserves. But we can clearly see that top earning does not always correlate with top performance. Many of the highest earning batteries are beneficially located at more volatile nodes – in fact, 11 of the top 20 earners were one of the top 20 most volatile storage nodes. For this reason, they have more revenue opportunity, so see a higher total dollar amount, despite not capturing as much of their revenue opportunity (as measured by their TB2).
More on this in the next section.
Performance outcomes
As always, performance outcomes varied widely across the fleet.
- Top performing asset captured 119% of their DA TB2
- Top 20 performers averaged 95%
- Median battery captured 56%
Interestingly, across the first half of the year, we see a variety in strategy for top performing operators. Many made the majority of their revenue in RT energy, but strategically layered in AS to boost their outcomes. However, we also see a number of successful assets that made most of their revenue in DA energy – supplementing with a bit of RT energy and/or AS.
This just underscores how every node in ERCOT is unique. The right strategy for one battery is almost certainly not optimal for another. Node-specific forecasts and tailored operating strategies are the only way to maximize your revenue opportunity and approach that desired 100%+ TB2 capture.
It is also notable that the RT TB2 capture distribution is heavily clustered around the low-to-mid range (40–50%) mean, with only a handful of outliers pushing above 70%. This shows that while a few assets executed nearer-to-optimal strategies, most fell short of capturing even half of their theoretical opportunity. The revenue distribution tells a similar story. Most assets earned between $1.50–3.00/kW-month, with only a small group breaking out above $4.00.
Together, these distributions highlight just how concentrated outperformance remains. A few high-executing operators consistently pull ahead, while the bulk of the fleet struggles to translate opportunity into realized revenue.

Operating Strategy Takeaways
ERCOT Ancillary Services (AS) made up the largest share of fleet-wide revenue at 42%, followed by Real-Time (RT) energy at 40% and Day-Ahead (DA) energy making up the remainder.
Isolating to the top revenue generators, energy storage assets brought in ~56% of their revenue from RT energy – about 1.4x the average. This concentration suggests that the assets with top revenue outcomes bet on price spikes, and benefitted from nodal volatility. In contrast, the top performing (highest TB2 capture) battery energy storage systems more proactively layered in DA energy and AS to capture more of the revenue opportunity available to them.
What can we take away from this?
- Those operating most optimally executed a strategy specific to their node, often incorporating DA energy and/or AS rather than just waiting for RT price spikes.
- For the majority of operators, this strategy will be the best one. But it requires highly attuned forecasts and agile optimization to execute well.
This is all going to be changing – soon – with RTC+B. When ERCOT begins co-optimizing energy and AS in RT, pricing dynamics and revenue opportunities are bound to shift. Operating strategies will have to adjust accordingly. More on RTC+B here >>
A fast changing market
To contextualize these data, we compared what we were seeing to the same time last year – H1 2024 – and dug into Q1 vs Q2 2025.
H1 2025 vs H1 2024
While average revenue was similar year-over-year, performance was way down.
- Revenue ($/kW-month): $2.46 in H1 2024 vs. $2.33 in 2025
- Performance (% DA TB2 captured): 78% in H1 2024 vs. 56% in 2025
Much more revenue is now being made in energy products versus Ancillary Services. In H1 2024, ECRS was newly launched and since a limited number of batteries were able to bid into it, it was clearing at high prices. While this normalized over the proceeding months, more revenue shifted into energy.
Q1 vs. Q2 2025
Diving into the quarter-by-quarter breakdown, we see both revenue and revenue opportunity are up a bit in Q2 compared to Q1. May was a particularly lucrative month in ERCOT, which likely accounted for much of the increase.
We also notice revenue shifting back into AS. In Q1, DA and RT energy were both lucrative for storage. In Q2, much less was made in DA energy and AS ticked up significantly. This is particularly interesting on the eve of RTC+B where the revenue opportunities in AS will certainly be changing.
Interesting Days
Finally, as we’ve alluded to throughout, there were not a ton of notable days throughout H1. In fact, there were exactly three days that stand out in terms of total fleet revenue.
- On May 16th, there was one of the few RT energy price spikes of the year that posed a high revenue opportunity for storage. Then on May 20th, primarily driven by elevated AS prices. We break down both in our May report.
- February 20th was the third highest grossing day, driven by a mix of RT energy and AS – we break down in our February report.
*Top earners defined as highest $/kW
**Top performers defined as highest percent of day-ahead TB2 captured
-
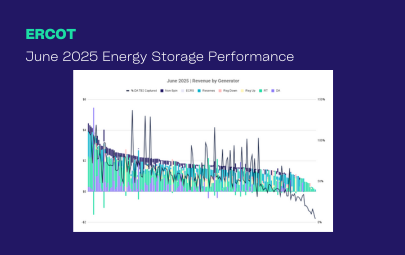
ERCOT Storage Performance
June 2025 Performance | ERCOT
09/16/25
-
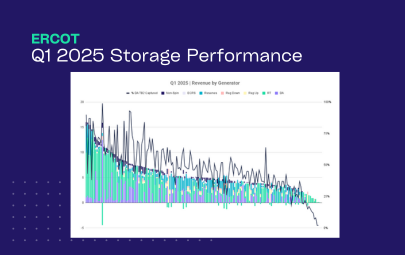
ERCOT Storage Performance
Q1 2025 Performance | ERCOT
06/26/25
-
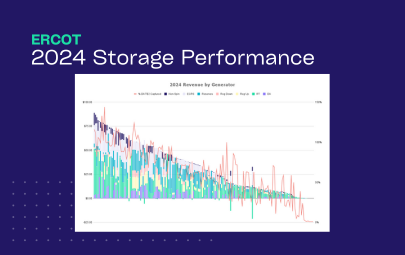
ERCOT Storage Performance
2024 Storage Performance | ERCOT
04/09/25
-
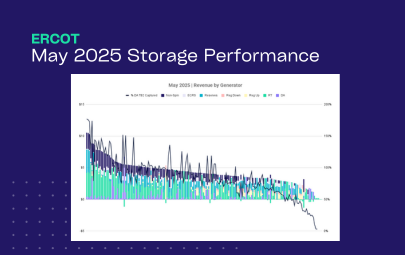
ERCOT Storage Performance
May 2025 Performance | ERCOT
08/12/25
-
ERCOT Storage Performance
April 2025 Performance | ERCOT
07/15/25
-

Guides
Benchmarking Energy Storage Performance in ERCOT: What Good Looks Like
02/24/25