ERCOT Storage Performance
ERCOT Storage Performance | June 2025
Looking back at storage asset operations and performance outcomes from June 2025.
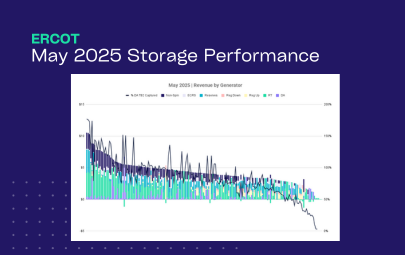
June was a low revenue opportunity month for ERCOT storage. Down -57% month-over-month, the fleetwide average revenue for energy storage systems fell to $1.87/kW from $4.39/kW in May. Ancillary Services (AS) again made up the majority of revenue – a continuation from May – while Real-Time (RT) energy took a slightly larger share. Together, these signals point to a cooling market where minute strategy execution matters most.
Revenue outcomes
In June, storage assets on more volatile nodes topped the leaderboard while the most consistent high performers (measured by percent of TB2 captured) leaned on AS.
- Highest earning asset made $4.45/kW, while the top 50 revenue generators averaged $2.76/kW
- The median asset brought in $1.74/kW, with the fleet average was slightly higher at $1.87/kW
- AS made up 45% of fleet revenue, rising to 49% for the top 20 performers and falling to 28% for the top 20 earners
Asset performance
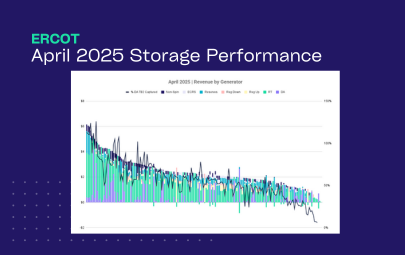
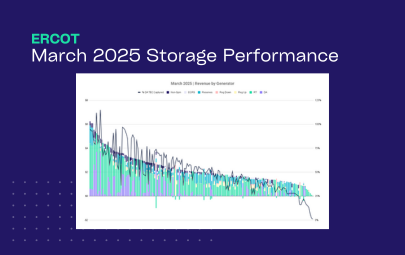
Fleet performance was down month-over-month. The average DA TB2 capture took a significant drop (86% in May vs. 59% in June). However, this outcome is in line with March and April results. Top performers proved that in low volatile months like this, it’s critical to balance your product mix to have the competitive advantage.
- Top asset captured 137% of its DA TB2 opportunity, and the top 50 averaged 88%
- Median asset captured 57%, with the fleet average coming in similarly at 59%
These benchmarks help normalize for nodal volatility and shine a light on what really matters: how well did your asset convert the available opportunity into real revenue?
Across the month, top performers did not follow one playbook. Some assets were almost all AS, which is rare. Others leaned hard on DA energy, and a smaller group won with a RT-first profile with AS layered on. The spread shows how dynamic operators need to be when planning and executing across products.

ERCOT market is cooling
In June, RT energy was quiet. RT energy made up only 39% of overall revenue, a slight improvement from May. Across nodes, prices cleared above $600/MWh only twice and above $400/MWh only five times, leaving little room for one-spike wins. The revenue mix was instead shifted toward AS (shown in the product mix of top and bottom performers), which is exactly what you expect when pricing is steadier. This points to growing storage capacity in ERCOT, with batteries absorbing volatility and helping keep prices lower for consumers as intended.
The interesting part of AS leading in May and June is that the market – especially the way AS is procured – is going to be changing drastically in just a few months. RTC+B will bring the co-optimization of energy and AS in RT, leading to new pricing dynamics, new trade-offs, and more complexity when optimizing AS.
The story remains the same for ERCOT – operators must stay agile. Keep coverage across products and be ready to pivot quickly when signals change. Agility is the edge, and after RTC+B the pace of decisions will quicken further. Without an optimizer like Tyba, maintaining that flexibility day after day becomes harder just as competition becomes tighter.
Interesting day deep dives
June was on the quieter side, and the two highest grossing days for the fleet did not look the same.
- June 18th saw almost half of revenue come from AS.
- June 27th had one of the few RT price spikes of the month.
If it’s not clear thus far, these days underline the importance of aligning daily strategy with market signals, especially as the playing field is becoming more level.
June 18, 2025
At 8pm on June 18th, DA energy cleared at $135/MWh while ECRS and Reserves cleared at $42.80/MWh. Most operators favored AS and only a few captured the DA energy spike.
This suggests that many operators didn’t anticipate the DA premium or saw more value in bidding into AS to preserve RT flexibility.
How did top energy storage systems operate?
One of the top earning West Load Zone assets from June did not capture the DA energy premium, but stacked AS products to yield high revenue outcomes. This battery did some RT energy discharge in the morning to pick up prices ~$66, then charged midday when RT energy was low. This ensured they would have sufficient SOC to cover their AS obligations, and set them up in case RT energy prices spiked in the evening. With Reserves and Non-Spin obligations into the evening, the asset captured $0.08/kW in the 7-9pm.
This approach was representative of much of the fleet. None of the month’s top earners captured the DA energy peak – and since so much of the fleet’s revenue on June 18th was in AS, we can see that the majority of assets did the same.
While popular, this was not the optimal strategy. The asset missed the elevated Day-Ahead energy prices that would have yielded higher revenue. Even so, the approach produced $0.50/kW for the day because AS prices were relatively high.
June 27, 2025
On June 27, one of the month’s few elevated RT energy prices appeared, making up 67% of fleet revenue that day. From 7-9pm it reached $129.40/MWh, which is modest by ERCOT standards but consistent with a cooler market we saw throughout June. The relatively higher prices came as load briefly exceeded the ERCOT load forecast. It leveled off quickly, though, as 4.2GW of storage discharged and easily met demand.
What did a top operating strategy look like?
We are highlighting two approaches to the same 7-9pm window because no single playbook fits every asset. Node conditions, state of charge, existing DA positions, and AS commitments all shape what is possible.
In the first approach the operator cleared AS bids throughout the day and into the evening. This inhibited a full discharge into the evening spike, but did get them some incremental revenue throughout the day. The balance delivered $0.14/kW during the peak hours and $0.23/kW for the day.
In the second approach the operator committed fully to RT energy for the high priced hours. The asset prepared for the evening peak with midday charge and then captured the full spike. This delivered $0.19/kW during the peak hours and $0.17/kW for the day.
June underscored a simple lesson. Lean on high-quality forecasts so you can build a daily bidding plan that fits that day’s conditions across AS, DA, and RT. In calm months there is little to set you apart, so flexible strategy is what turns small openings into incremental revenue.
*Top earners defined as highest $/kW
**Top performers defined as highest percent of day-ahead TB2 captured
