ERCOT Storage Performance
ERCOT Storage Performance | March 2025
Looking back at storage asset operations and performance outcomes from March 2025.
March 2025 was a quintessential shoulder season month in ERCOT. Despite generally low volatility, energy storage systems leaned heavily on energy arbitrage for the majority of their revenue. While there were no major price spikes, both DA and RT energy prices crossed into the triple digits a handful of times giving savvy operators opportunities to pick up revenue throughout the month.
Performance Overview
While overall fleet revenues were moderate, a meaningful spread emerged between top and median performers — underscoring the continued importance of tactical bidding to deliver on revenue goals.
Revenue outcomes:
- Highest earning asset made $6.26/kW, while the top 50 revenue generators averaged $3.80/kW
- Median asset brought in $2.00/kW, with the fleet average slightly higher at $2.30/kW
- ~69% of total revenue came from energy arbitrage, and 74% of that was tied to Real-Time (RT) energy
From a performance (measured by percent of DA TB2 captured) standpoint:
There were just two assets that exceeded their DA TB2 in March.
- Top asset captured 115% of its DA TB2 opportunity, and the top 50 averaged 78%
- Median asset captured just 48%, with the fleet average coming in at 51%
These benchmarks better illustrate operating strategy efficacy as they normalize for nodal volatility. This shows, of the revenue opportunity available, how much was the asset able to capture?
Even in this relatively calm market environment, outcomes across the fleet varied widely.
- Revenue spread: Average revenue across the fleet was $2.30/kW with a standard deviation of $1.20/kW. This means that 68% earned between ~$1.10/kW and ~$3.50/kW. This indicates that revenue outcomes were quite varied and inconsistent across assets.
- Performance spread: A 21% standard deviation tells us that 68% of assets captured somewhere between 30% and 72% of their DA TB2. This wide performance gap with a long tail of underperformance suggests many operators left significant revenue on the table, while a smaller set outperformed.
In both cases, the standard deviation indicates divergence in operator performance and underscores the upside potential available to assets with strong bidding strategy, forecasting capabilities, and real-time responsiveness.

Predominance of Energy Arbitrage
Across the fleet, we saw the vast majority of revenue, ~69%, coming from energy arbitrage. What’s more, 74% of that energy revenue was made in RT energy. This is particularly interesting given in March, RT average hourly Real-Time energy prices across storage nodes maxed out around $400 – and this only happened in one interval, at one node.
In fact, on most days throughout the month RT energy prices peaked in the double, or low triple digits.
Even so, top revenue generators and top performers made ~84% of revenue in energy. The mix of DA and RT energy was a bit different, though, with top revenue generators over-indexing on RT energy and top performers incorporating more DA energy. This implies that top revenue generators benefit from outsized RT opportunities, whereas top performers navigate DA vs. RT opportunity to drive higher capture.
This just reiterates that the majority of the revenue opportunity in ERCOT has shifted in energy arbitrage – and operators coming out on top are:
- Evolving their strategies to reflect this reality
- Capture the spread most effectively
Interesting day deep dives
There were a handful of days with moderate revenue throughout the month, but one clear standout – March 24th – where storage assets grossed ~$2.4M, nearly 2x the revenue of the next best day.
March 24, 2025
On March 24th there were a lot of winners. Both DA and RT energy cleared relatively high – over $250 and $150 respectively – from 7-9pm. In some Load Zones (West), this was preceded by somewhat lower, but still compelling price activity in the early morning where prices stayed ~$100 for a few hours.
These factors made it so almost any bet on energy had positive results – though forecasting the elevated DA energy prints was the key to top performance.
How did top energy storage systems operate?
Since pricing – and operator strategy – varied by zone, let’s take a look at two examples.
ERCOT’s West Load Zone
Top assets in the West LZ all showed remarkably similar revenue stacks on March 24th. Revenue was pretty evenly split between DA energy (~31%), RT energy (~31%) and Reserves (~27%), with a bit of Non-Spin layered on top.
Top performing asset strategy:
The month’s top performing asset in the West Load Zone net $0.65/kW on 3/24. In the first couple hours of the day, the asset captured elevated RT energy prices around $100/MWh.
The bulk of the battery’s daily revenue came from Reserves participation throughout the day paired with a DA energy position during the evening peak from 7-9pm when prices reached $250.
Median performing asset strategy:
A median performing asset in this zone generated less than half the revenue, ending the day at $0.25/kW. This storage system had bid less than half of its capacity into DA energy during the 7pm and 8pm hours. This is a fair hedge (and similar to what the top performer did) if you want to leave space to sell if you think RT prices may spike, but it didn’t pan out in this instance.
To supplement, the battery still sold some RT energy in this time frame as well – but since prices were lower (~$100 less than DA), cumulative revenue suffered.
Unlike the top performing, missing the first RT energy discharge + no Ancillary Services revenue accounted for the lower revenue on the day.
ERCOT’s South Load Zone
The story in the South LZ is a bit different. The asset that grossed the highest revenue on 3/24 actually missed the high DA energy prices entirely. By contrast, the runner up captured some of the DA energy excitement – but given activity during the rest of the operating day still had a lower total revenue number.
Top performing asset strategy:
The day’s top revenue generator net $0.46/kW. While it missed the DA energy premium, the battery benefitted from elevated RT energy prices (~$100) at its node in the morning – and effectively captured RT energy prices ranging from $80-150 in the evening. Despite capturing more revenue than other assets in the South LZ, this operator did leave significant revenue on the table, not bidding into DA energy, which cleared ~$260 in that evening period.
Runner-up asset strategy:
The runner up generated $0.36/kW. This energy storage system made the right bet with DA, but went a bit too late. The battery had DA energy awards that began at 8pm while the peak ($215) was at 7pm. The battery still benefitted from relatively high prices ($186 and $99) – and supplemented with some RT energy discharge in the intervals immediately before and after these obligations.
This asset also began the day with a big charge action that impacted cumulative revenue a bit.
March reinforced a familiar reality in ERCOT:
-
Every node is unique. One battery may be experiencing elevated prices (and therefore revenue opportunity) while others nearby experience flat conditions.
-
For this reason, topline revenue does not always equal top performance.
-
Accurate forecasts that enable a strategic bidding strategy – unique to the day’s conditions are integral to success.
-
ERCOT Storage Performance
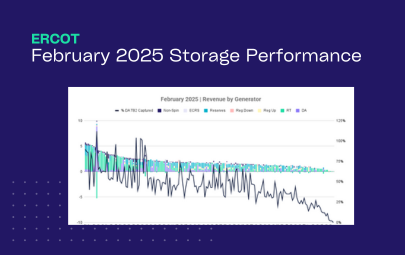
February 2025 Performance | ERCOT
05/13/25
-
ERCOT Storage Performance
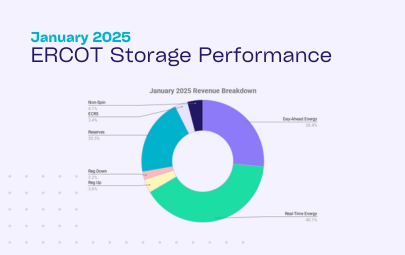
January 2025 Performance | ERCOT
04/28/25
-
ERCOT Storage Performance
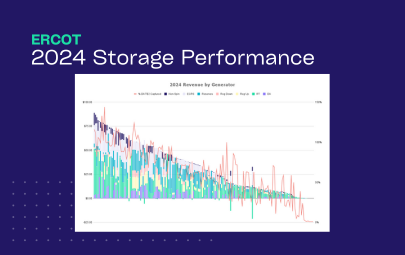
2024 Storage Performance | ERCOT
04/09/25
-

ERCOT Storage Performance
December 2024 Performance | ERCOT
03/17/25
-

ERCOT Storage Performance
November 2024 Performance | ERCOT
02/24/25
-

Guides
Benchmarking Energy Storage Performance in ERCOT: What Good Looks Like
02/24/25